 Learn hubBlog
COIN B&A
The indicator measures the bid and ask values at different depths for the coin you select. The value is shown in $mln or in the number of coins (depending on the indicator settings).
For the bid value: the indicator takes each depth and shows the value in $mln.
For the ask value: the indicator takes each depth and shows the value in $mln.
Available depths: 1.5% / 3% / 5% / 8% / 15% / 30% / 60%.
To open the indicator:
- go to the [DYOR] Indicators menu at the top of Multichart.
- select the COIN B&A indicator
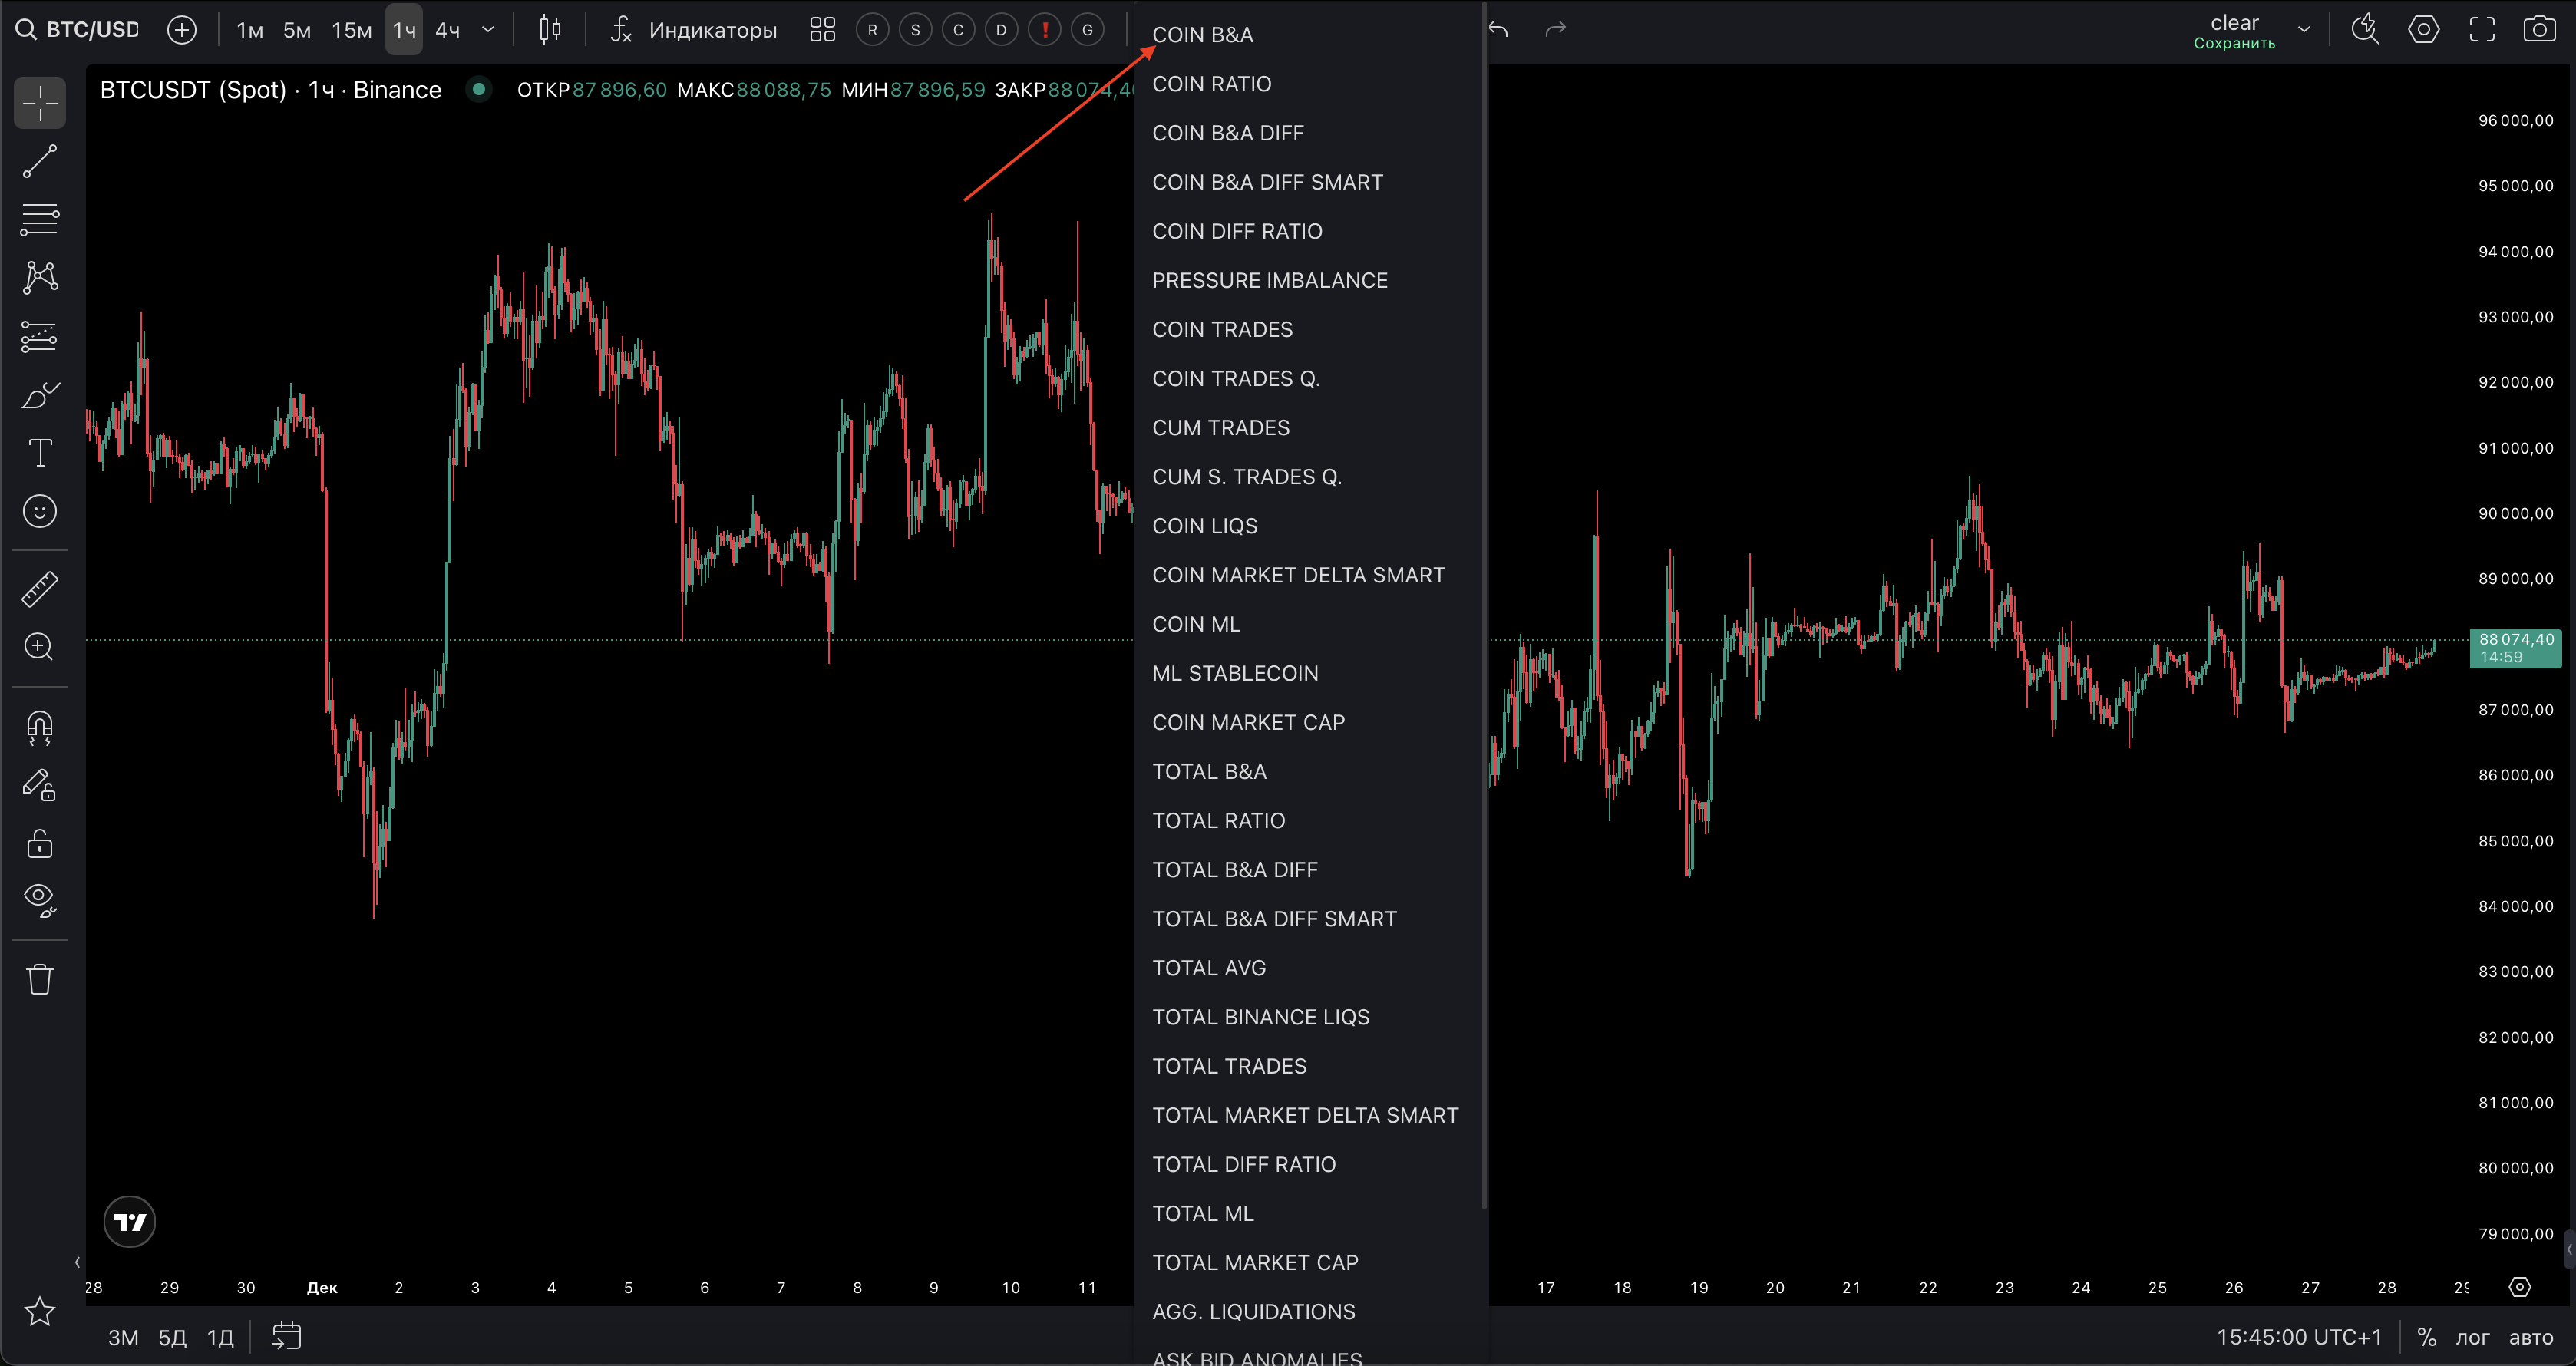
To open the indicator settings:
- hover your cursor over the top left part of the opened indicator
- click ⚙(the gear icon)
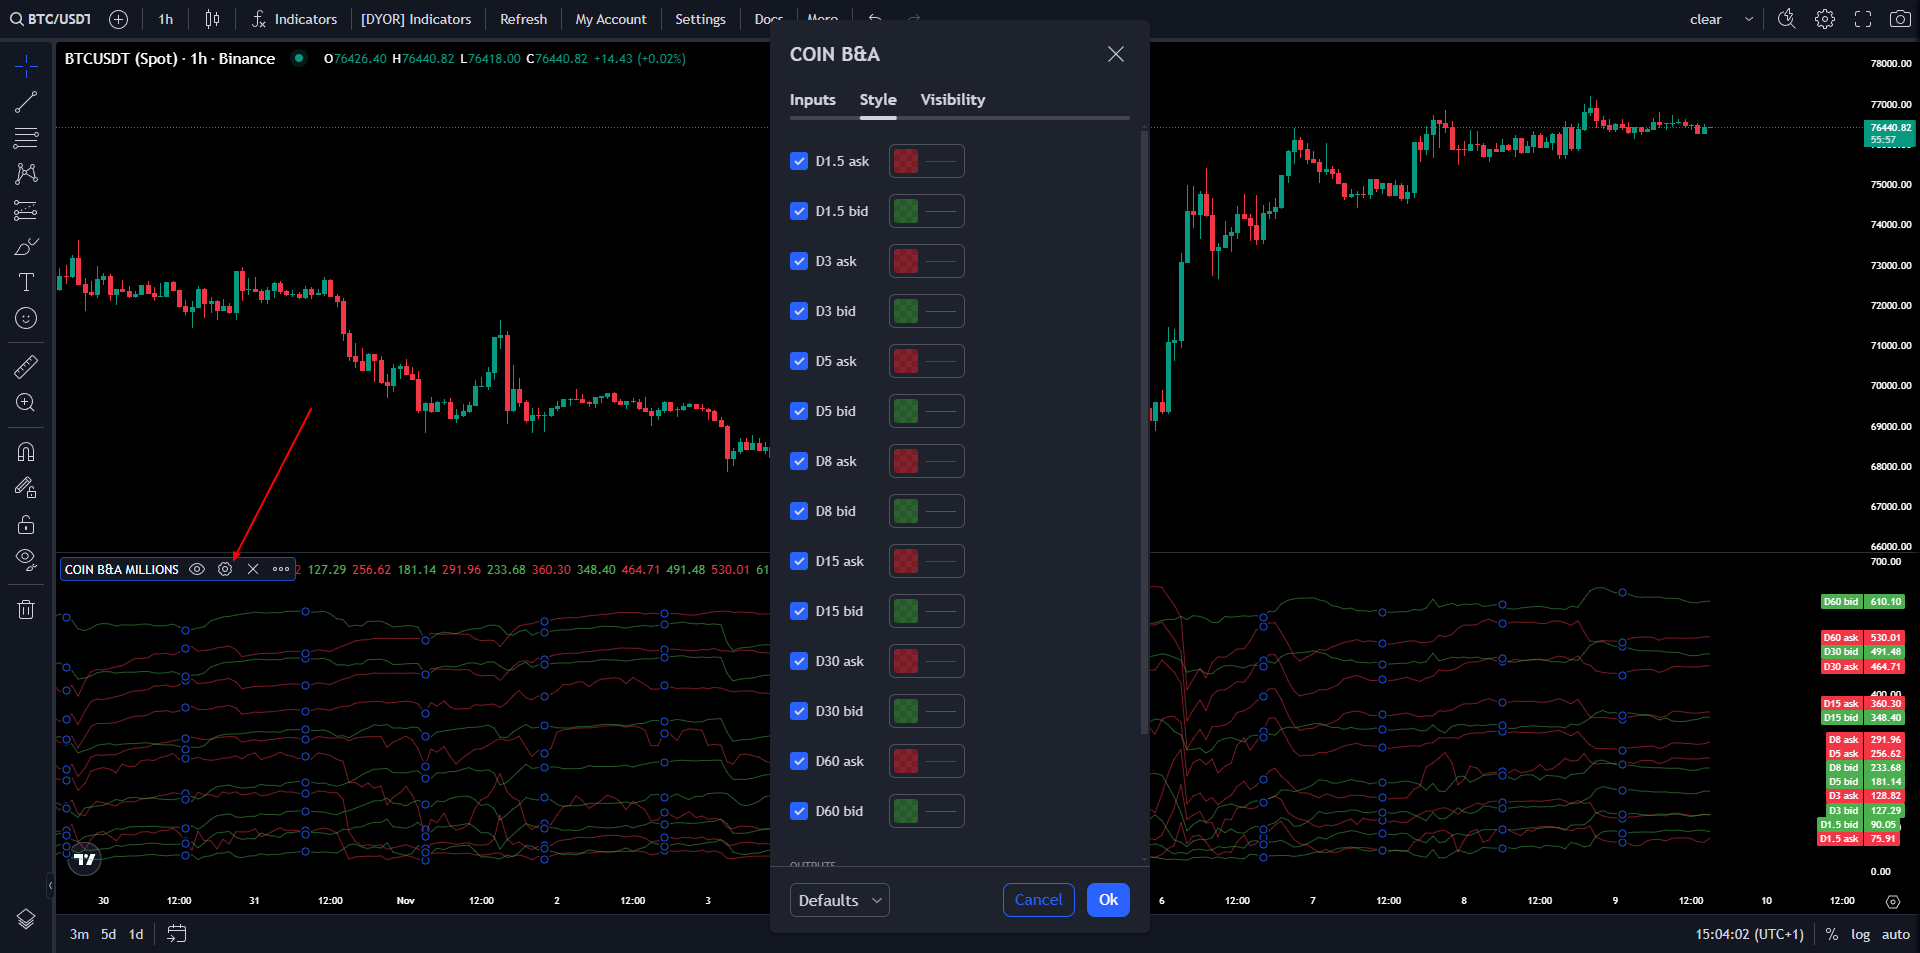
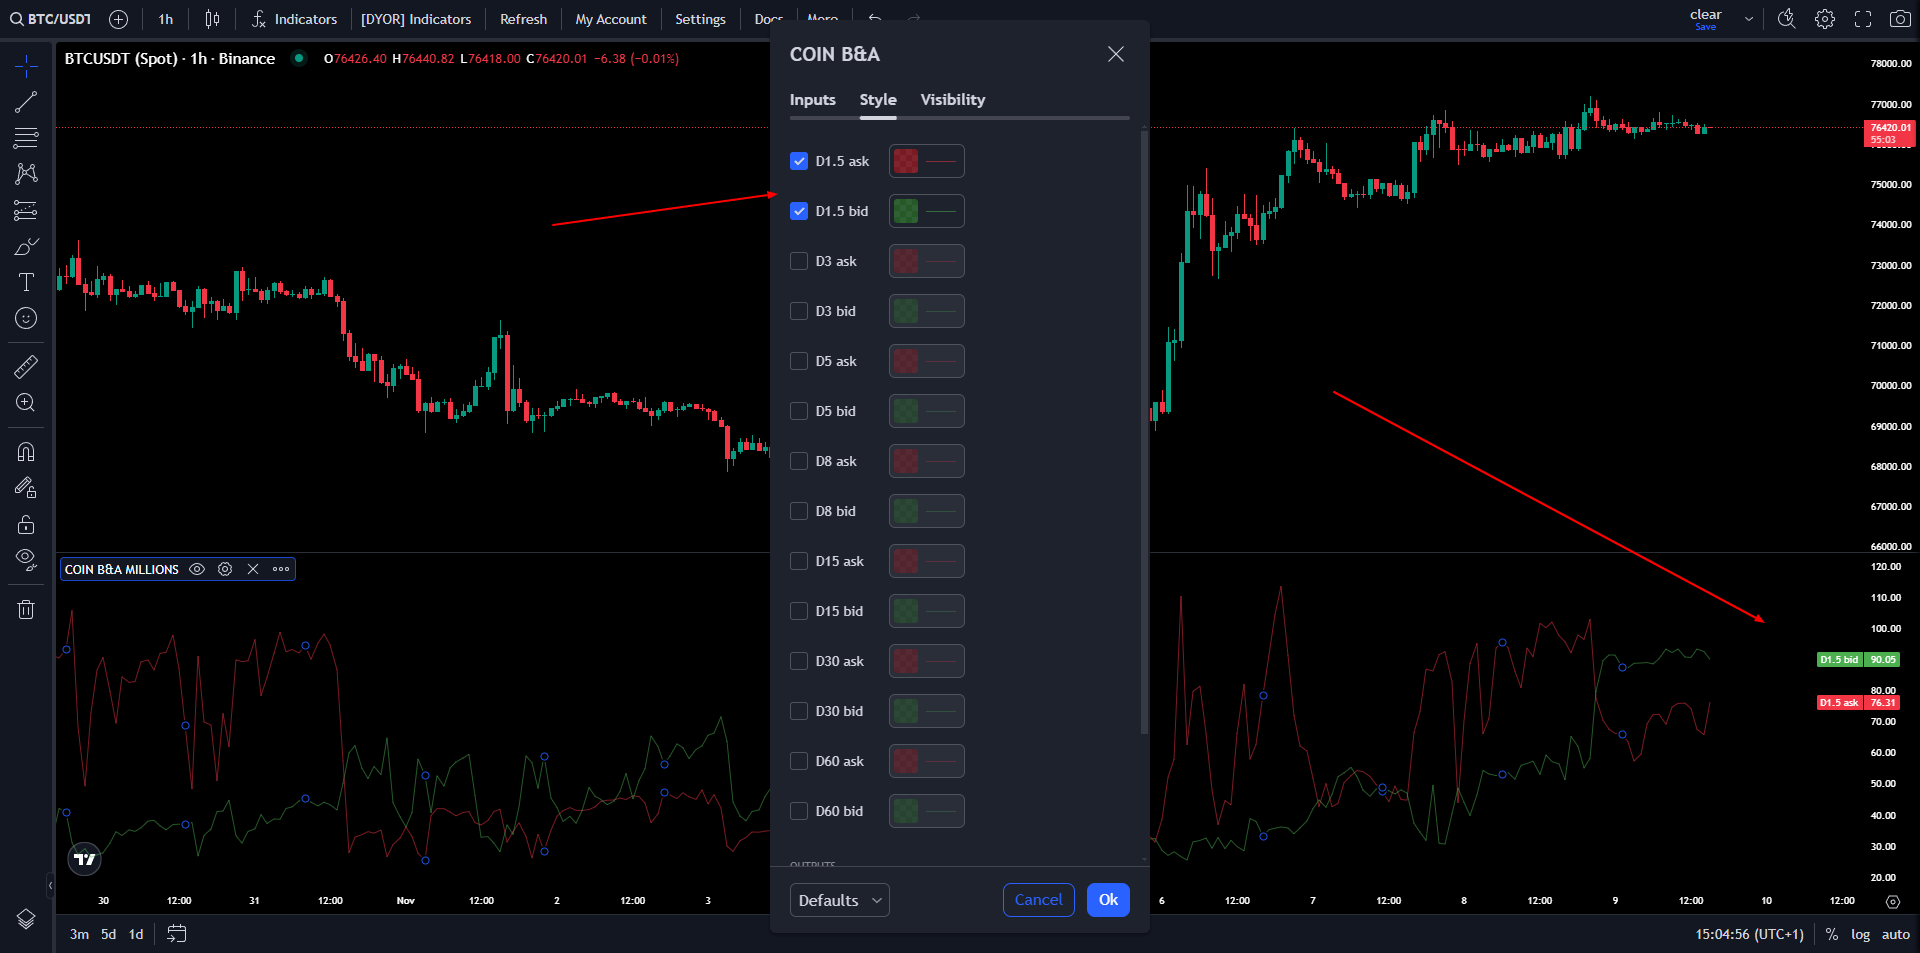
To enable\disable the depths with the data you are interested in:
- in the STYLE tab, check\uncheck the boxes next to the depths
- depths without a checkmark will no longer be displayed in the indicator
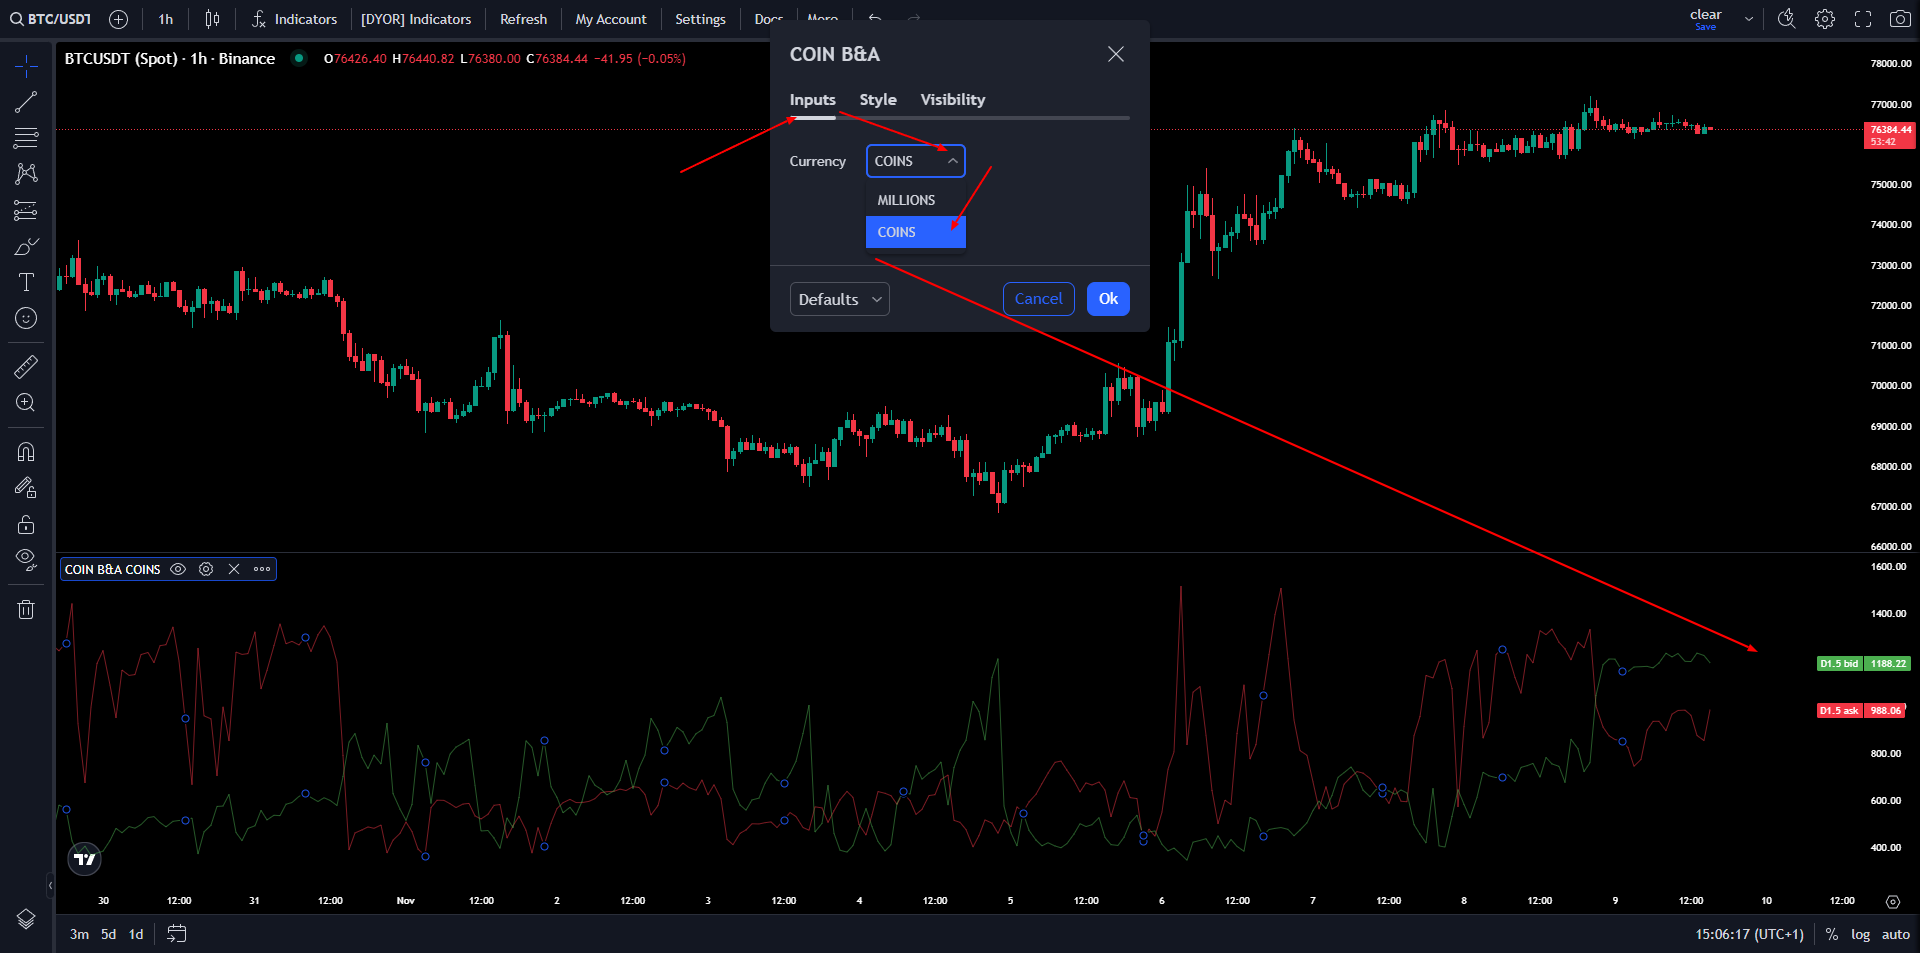
To switch the display between $mln and coins (number of coins):
- in the indicator settings, click Inputs
- then click the field next to Currency
- choose the display option you want
- the values on the right vertical scale will show the option you set
You need this indicator to analyze how much money limit buyers actually have to hold the price up against a drop, or limit sellers have to resist growth.
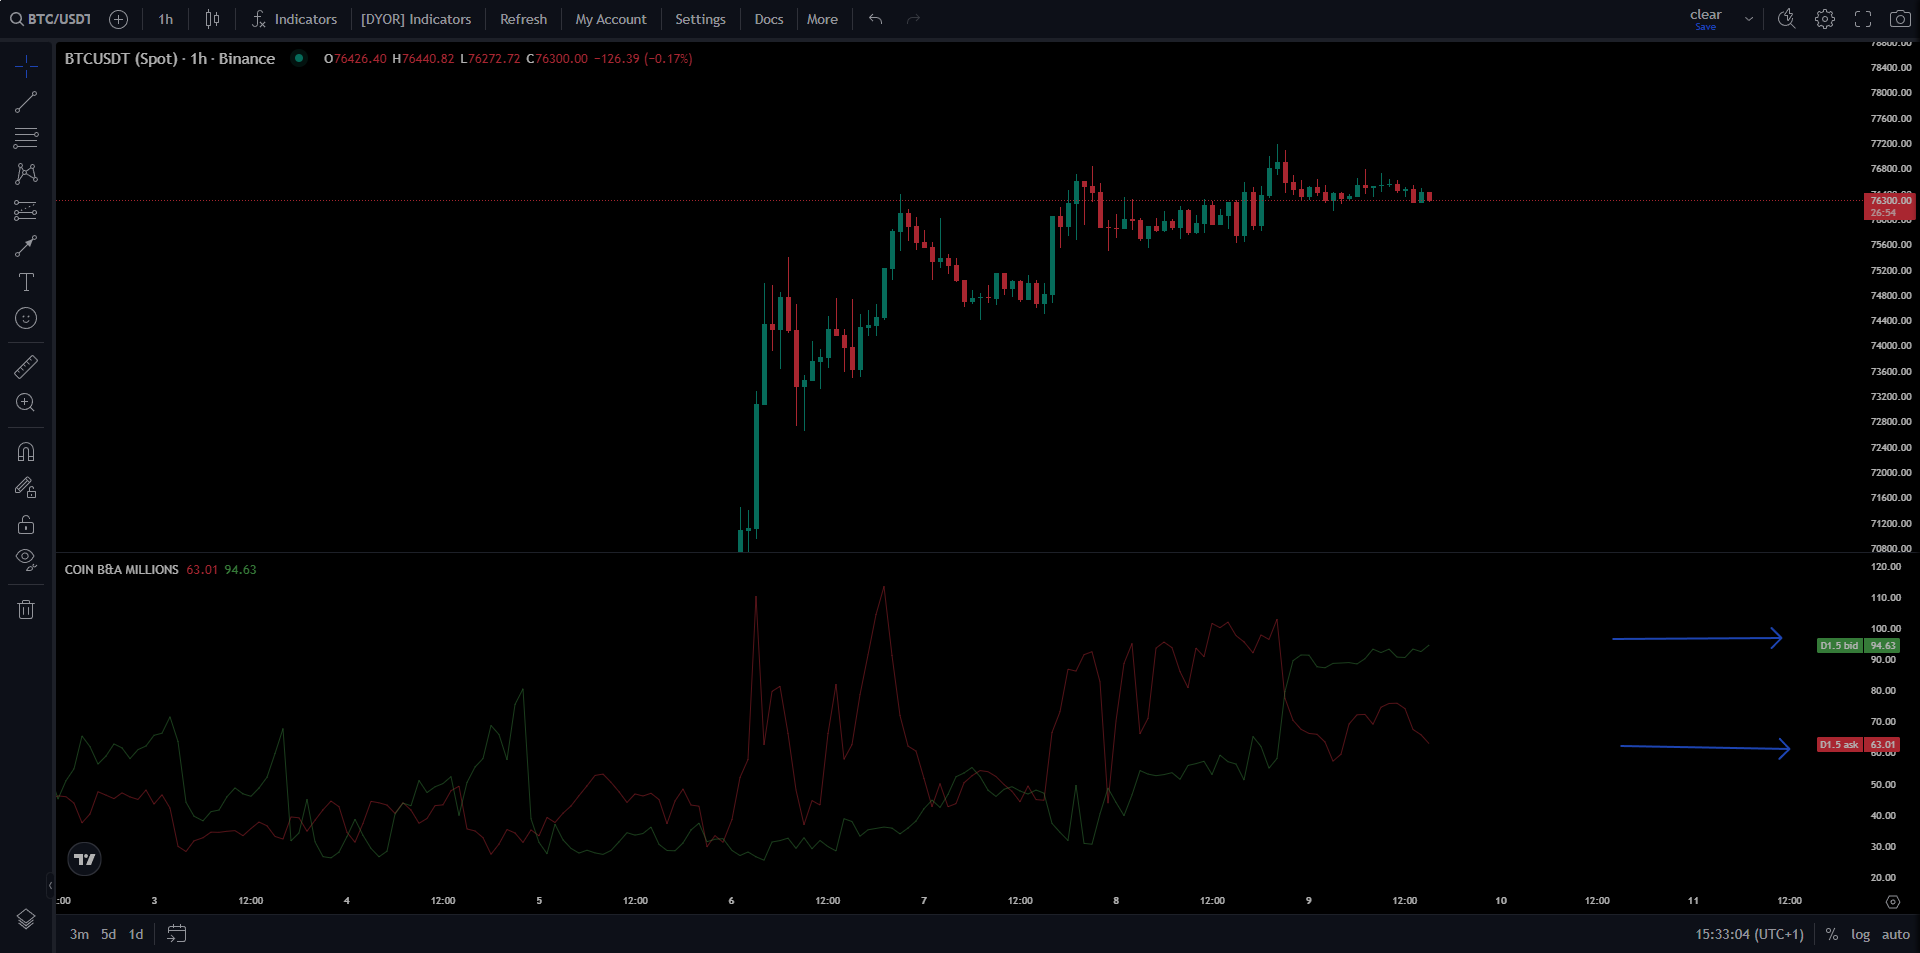
For example, using the COIN B&A indicator in this screenshot we can see that at a depth of 1.5% from the current price, on the BTC coin paired with USDT on the 5m timeframe, the values are:
bid 1,5% = 94.63$mln
ask 1,5% = 63.01$mln
Conclusion:
- Limit demand is greater than supply (Bid > Ask)
Does this mean the price will rise?
- Not necessarily. It only indicates that limit demand at this depth actually exceeds limit supply.
But what matters is not only the current value but also the dynamics: the screenshot shows that while bids are increasing and asks are decreasing - the price is moving sideways.
This can happen for the following reasons:
- bids increased, asks were pulled;
- asks were filled, and bids grew;
- the price moved closer to dense bids and away from dense asks.
With this indicator, what we need to understand is the dynamics and the actual values on the limit market participant's side; they are clearly ready to hold the current price or absorb significant selling.
Watch different depths.
Compare depth crossovers, for example when bid1,5% > ask5% - this can be very dense limit support that the price will bounce off (if market buyers step in).
Examples in the screenshot below:
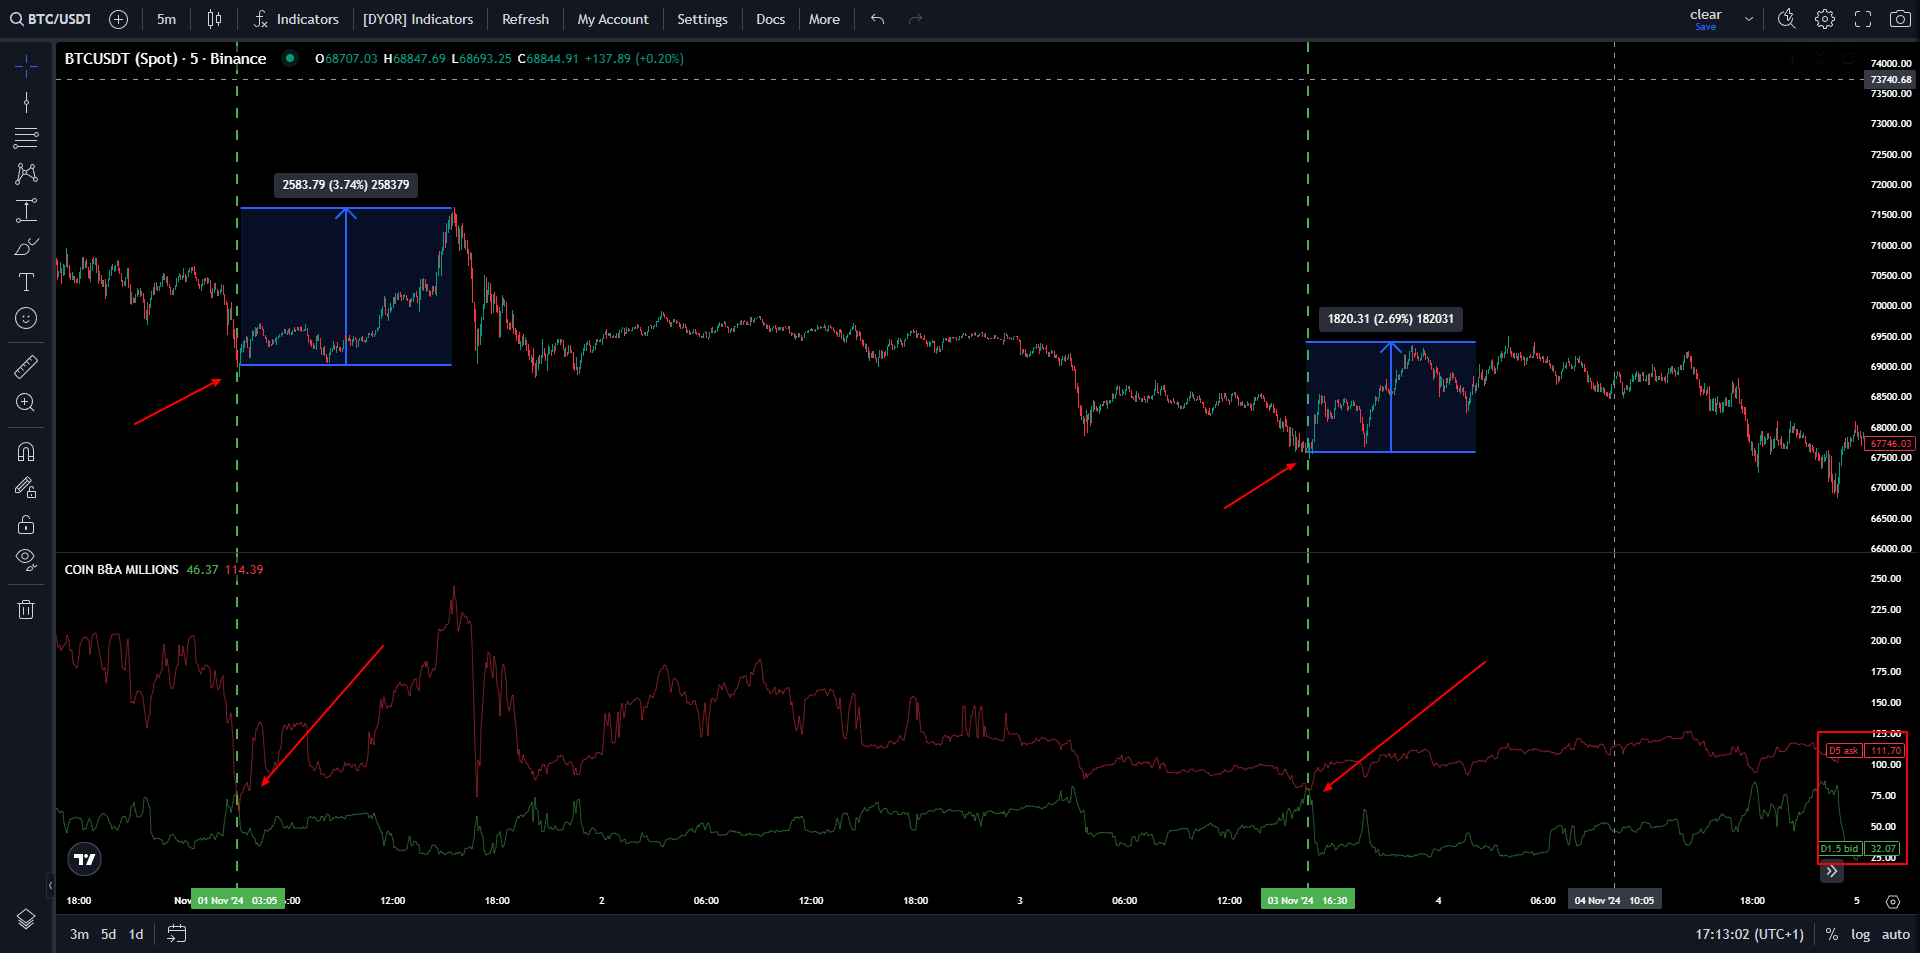
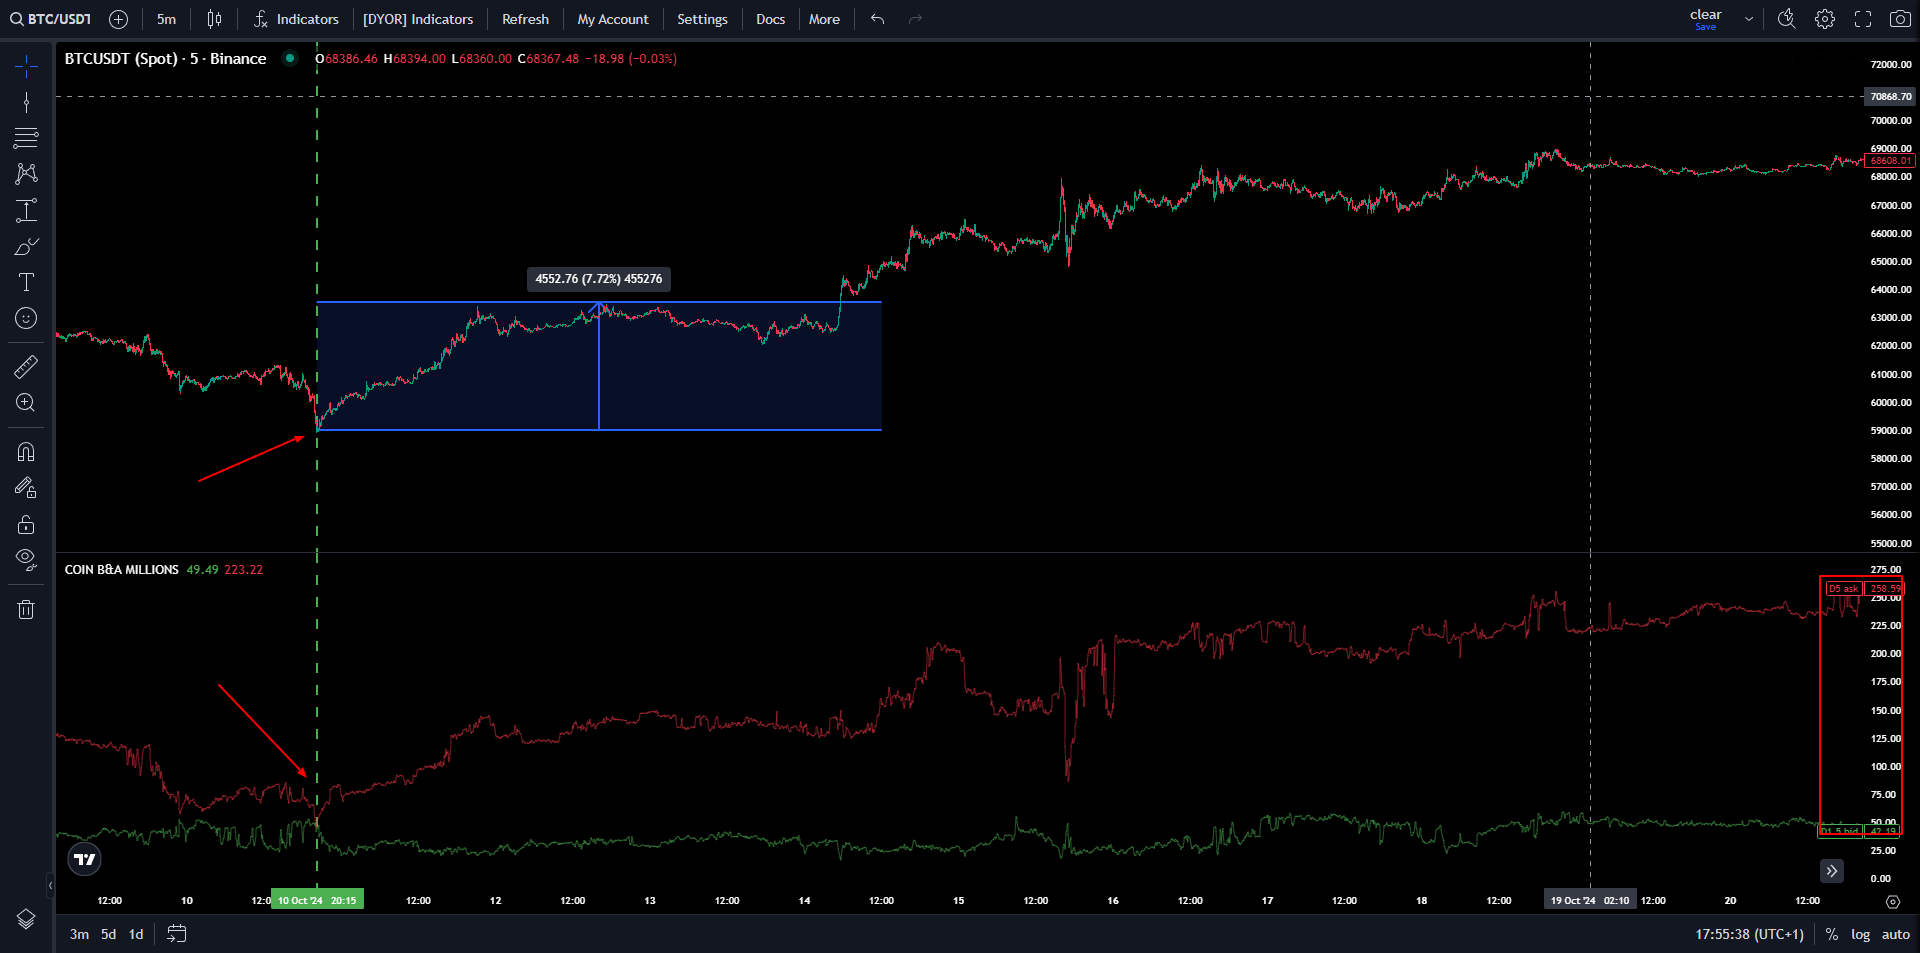
*Keep in mind, getting such a crossover on the 5m timeframe is a stronger argument than getting the same crossover on a lower timeframe.
The TOTAL B&A indicator shows the total (aggregated) volume of buy (bid) and sell (ask) limit orders on the market.
To do this, it collects and sums up order book data for all coins at the selected depths.
This data helps you understand how much money in total the market has ready to hold the price up or hold back its growth.
Available depths: 1.5%/3%/5%/8%/15%/30%/60%.
The settings are the same as COIN B&A: depth selection, but values are displayed only in $mln.
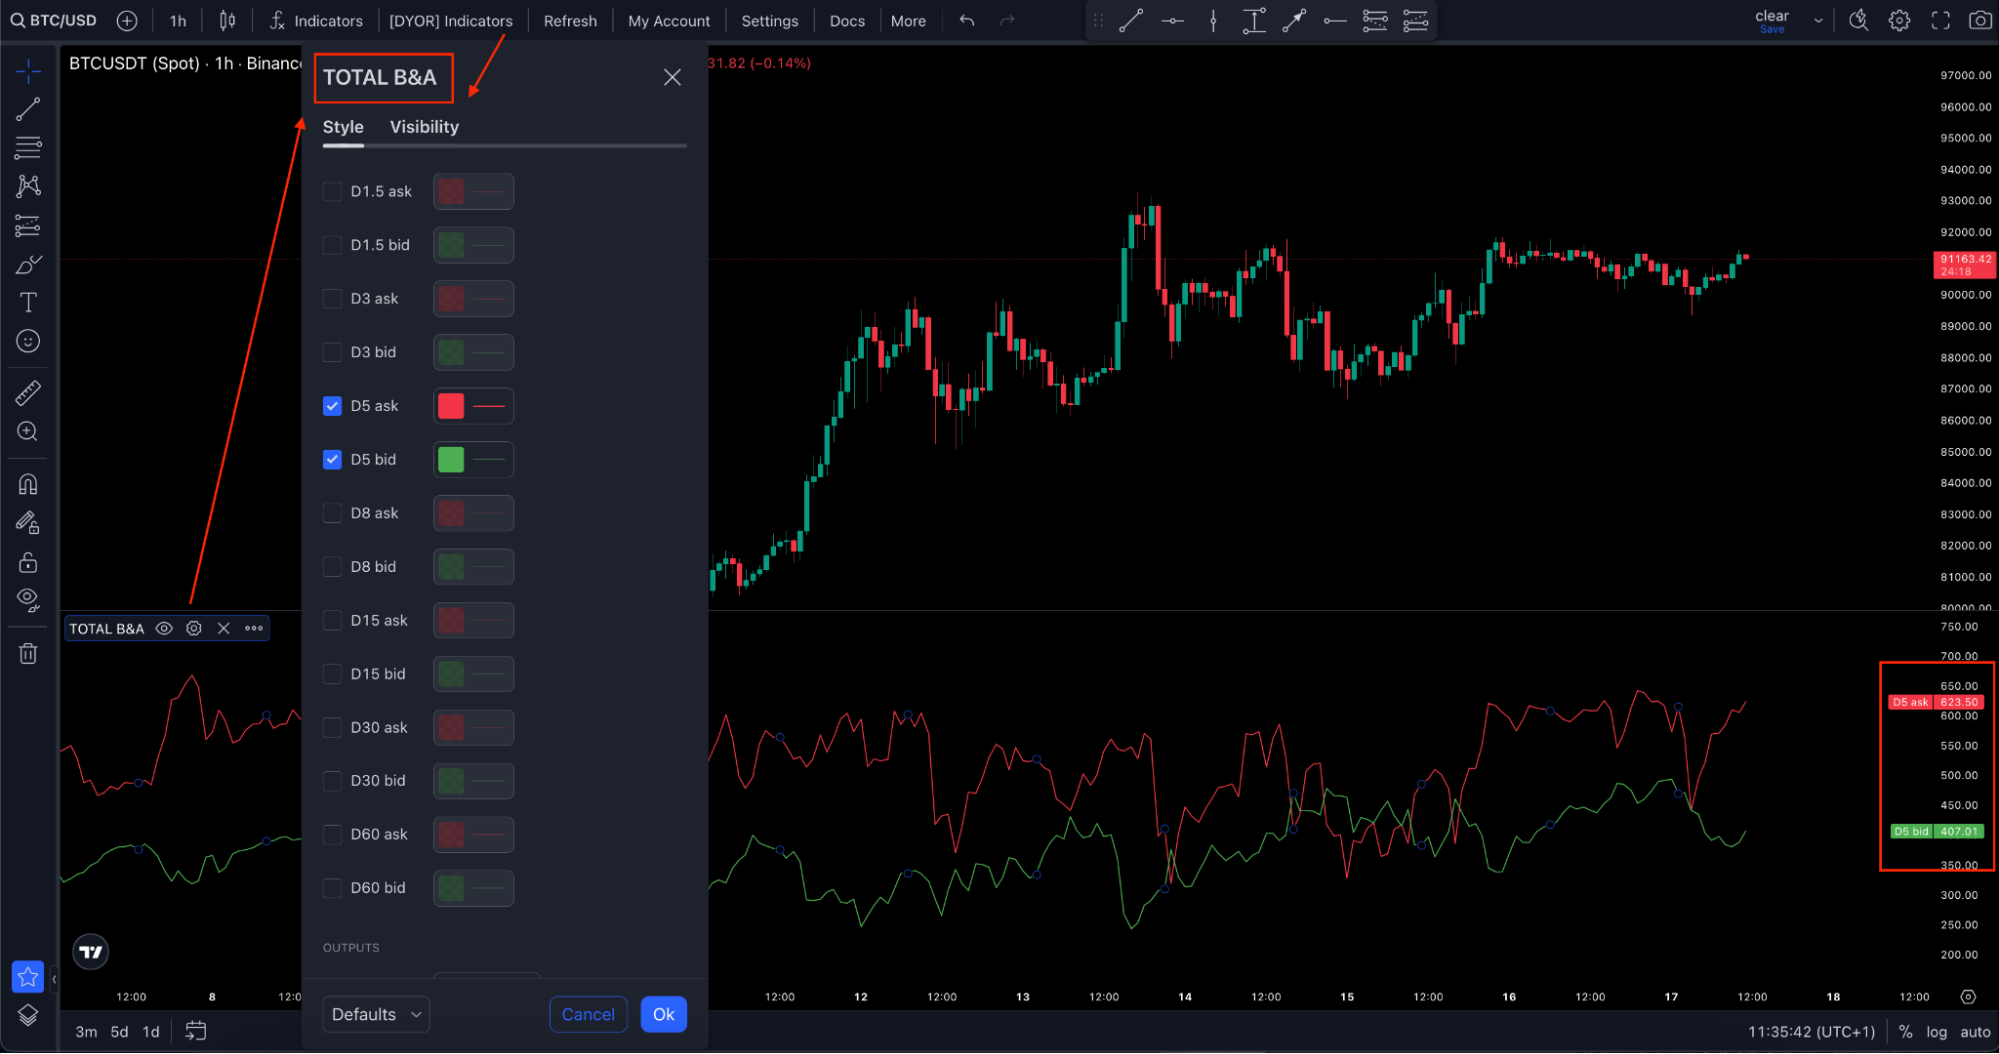
The main difference between TOTAL B&A and COIN B&A is the scale of analysis:
COIN B&A: analyzes the volumes of limit orders to buy (bid) and sell (ask) only for the selected coin. This gives a local picture of supply and demand for a specific asset.
TOTAL B&A: aggregates data across all coins on the market, showing the total bid and ask volumes. This lets you see the overall market situation.
COIN B&A is used to analyze a specific asset, while TOTAL B&A is used to assess the state of the whole market.
What does the COIN B&A indicator analyze?
Correct answer: Limit buy and sell orders for the selected coin only.
Which of these statements is true for TOTAL B&A?
Correct answer: It aggregates data for all coins on the market.
What information does the COIN B&A indicator provide?
Correct answer: The volume of limit buy and sell orders for one coin only.
What does it mean when at the 1.5% depth bid is greater than ask at the 5% depth in the **COIN B&A** indicator?
Correct answer: Limit demand at the 1.5% depth is greater than supply at the 5% depth; this points to an imbalance between demand and supply, which does not guarantee a rise but increases its chances.
🎉 Congratulations! 🎉
You have successfully completed the lesson on Coin B&A Total B&A!