 Learn hubBlog
Break down COIN MARKET DELTA SMART — trade skew over a window of N bars on a 0–100 scale.
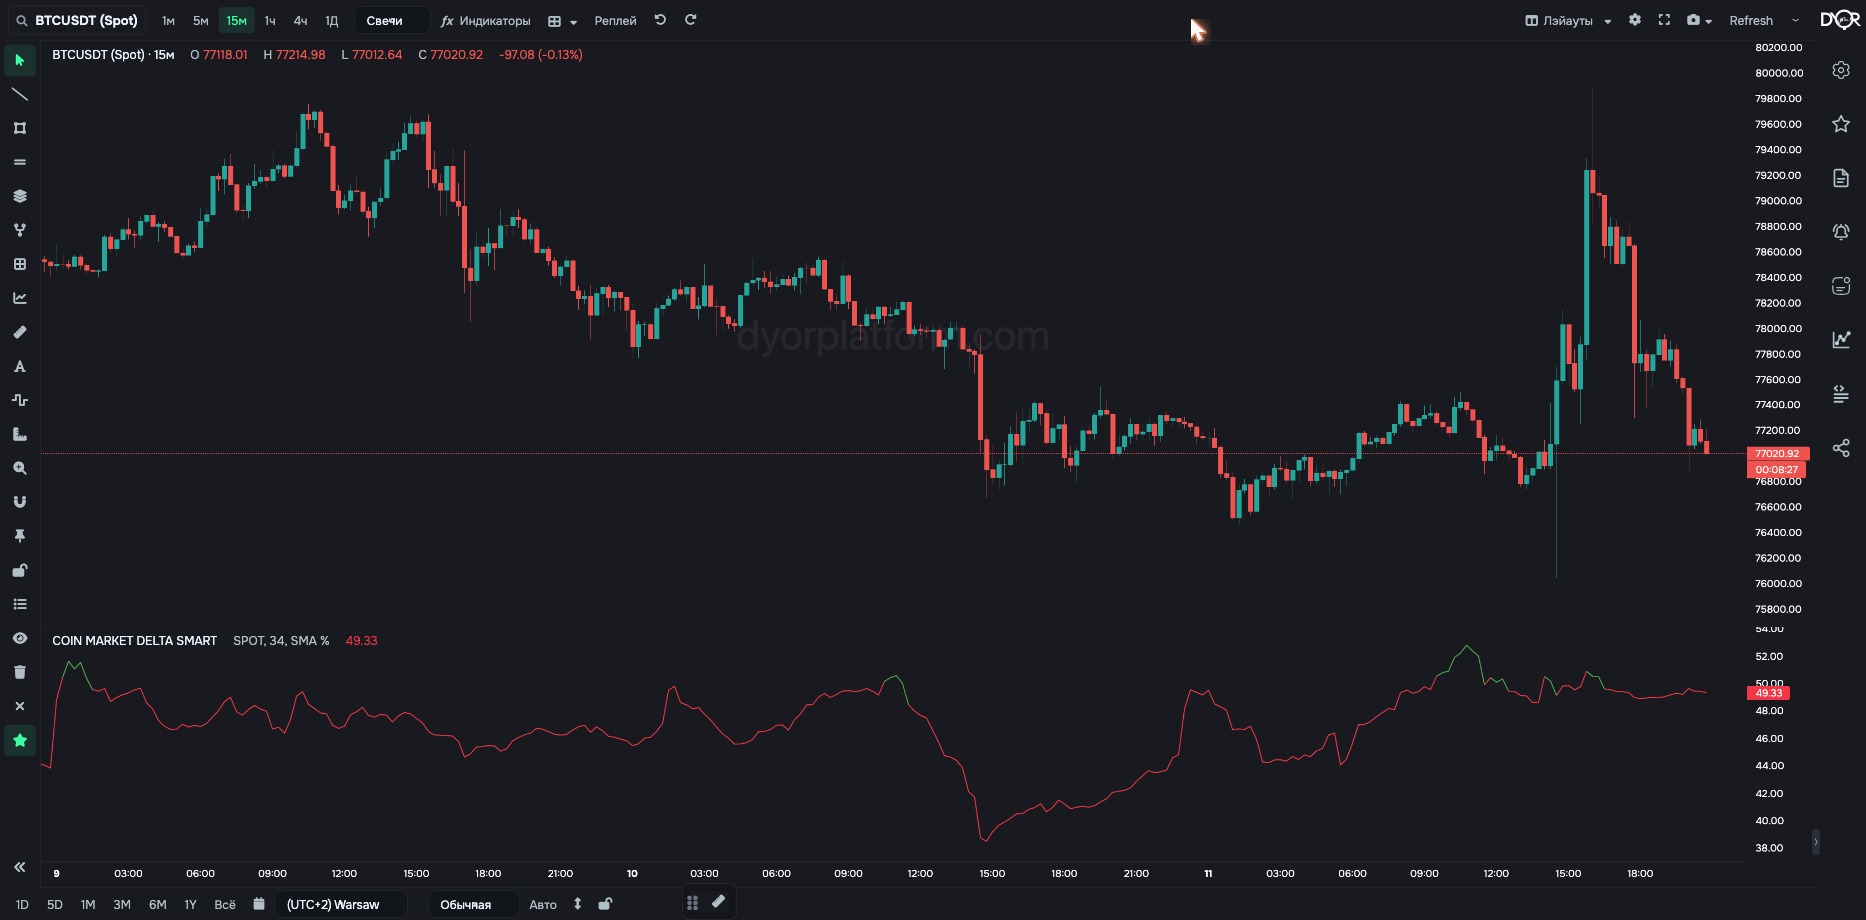
Skew of market trades over a window — the last N bars. Default N = 34.
How it is calculated:
See that a market buyer or seller overdid it. The indicator sums buys and sells over the window and shows the skew as one number. You can't buy or sell at market forever. Bought abnormally much — value far above 50 — expect a halt or opposing sells. Sold abnormally much — value far below 50 — expect a halt or opposing buys. One scale for all coins and timeframes.
For example.
A return to 50 happens in two ways, and they differ in strength. Through opposing trades — the market answered: buys were met with sells. Through time — the market went quiet: there were no trades, the window just moved on. The line itself can't tell these two cases apart. Only COIN TRADES next to it can: whether there is opposing-side volume in those bars or not. That's why MARKET DELTA SMART is read together with COIN TRADES, not instead of it.
| Field | Options | Default | What it changes |
|---|---|---|---|
| Market Type | SPOT FUTURES | SPOT | Whose trades to count: Binance spot or futures market. - Want trades of those buying the coin itself — SPOT. - Want leveraged trades — FUTURES. On Coinbase and Hyperliquid the switch has no effect: Coinbase is spot only, Hyperliquid is futures only, the value is set by the exchange automatically. |
| last bars count | 1 … 5000 | 34 | Window width in bars. Fewer bars — reacts faster but is noisy. More — smoother but lags. |
| Normalization | SMA % Sum Δ | SMA % | How to show the result: SMA % — a 0–100 scale by volume. Sum Δ — sum of the delta over the window in volume units. - Want a scale that is the same for all coins and timeframes — SMA %. - Want the skew in money or coins — Sum Δ. |
| BTC Pairs | ALL USDT ONLY | ALL | Works only on Binance and only on BTC. ALL — sum of three pairs: BTCUSDT + BTCUSDC + BTCFDUSD. USDT ONLY — only the BTCUSDT pair. For other Binance coins the data is always for the USDT pair; the parameter changes nothing. No effect on Coinbase and Hyperliquid: there bitcoin has one pair — BTC/USD and BTC/USDC. - Want all Binance bitcoin — ALL. - Want to compare with a source that counts only BTCUSDT — USDT ONLY. |
| Exchange | Chart Binance Coinbase Hyperliquid | Chart | Which exchange to take data from: Chart — the same one as the chart. Binance — spot and futures, USDT pairs. Coinbase — spot only, USD pairs. Hyperliquid — perpetual futures only, USDC pairs. Coinbase and Hyperliquid are available on paid plans (“Exchanges” screen). They have candles, trades and the order book. Derivatives, liquidations and loans show “no data” for them. - Want to compare one coin across exchanges — add the indicator several times and pick a different exchange in each. |
Metric COIN MARKET DELTA SMART. Condition fields:
“Last Bars” in the alert is picked from a list: 4, 6, 7, 8, 12, 17, 24, 34 and so on. “BTC pairs” appears only when the coin is BTC.
TOTAL MARKET DELTA SMART — the same, summed across the whole market. Adds the Total Type field.
MARKET DELTA SMART sums buys and sells over the last N bars (default 34) and converts the skew to a 0–100 scale. 50 — even, higher — more buys. The window counts in bars, not time: on 1m it is half an hour, on 1h a day and a half. A value far from 50 — one side overdid it: bought or sold abnormally much, next comes a pause or the opposing side. A return to 50 via opposing trades and a return via time are different events; you can tell them apart only by COIN TRADES.
A MARKET DELTA SMART value of 50 means…
Correct answer: Buys and sells are even over the window