 Learn hubBlog
Understand MSI — marks on candles where three conditions line up: trade delta, its direction and a stretched price — and what Strategy changes.
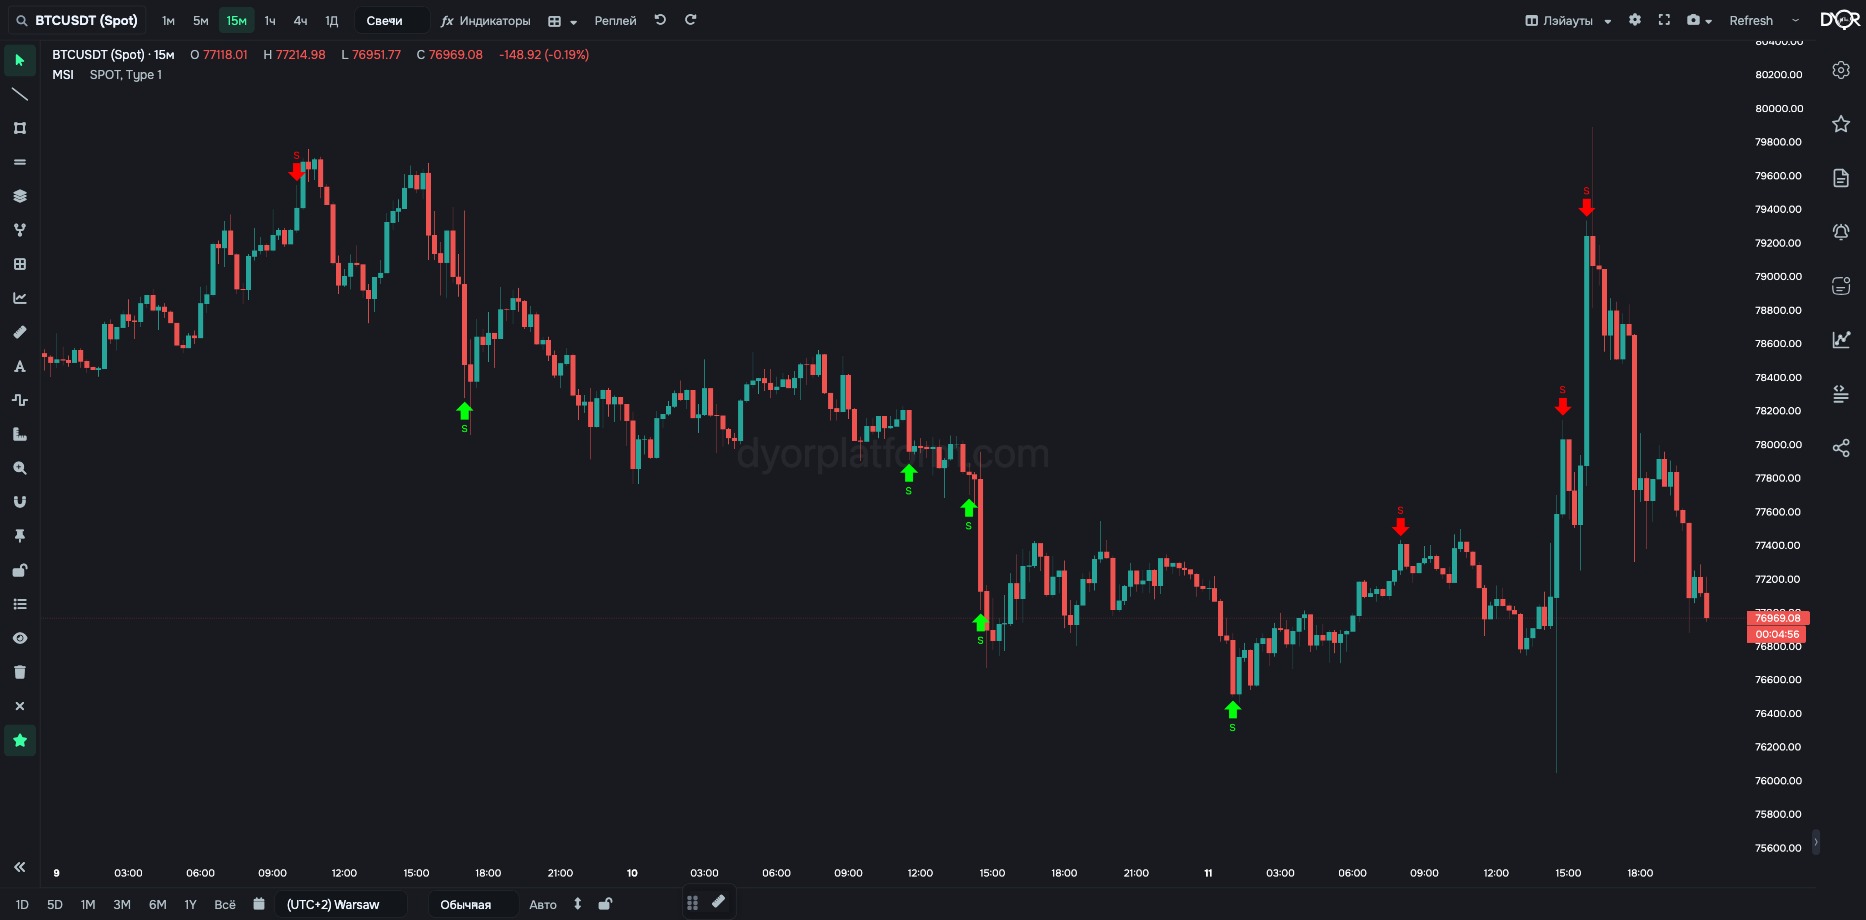
The only indicator without its own pane. Marks are drawn right on the candles: a green arrow below the candle (Signal UP) or a red one above it (Signal DOWN).
A mark appears when three conditions line up on the same bar:
The exact windows, multipliers and bounds are built into the indicator. Strategy changes them as one bundle.
After a mark, a level marker stays for a while: Ray UP / Ray DOWN.
So you don't have to watch the delta by hand. The indicator marks bars where trades swung sharply to one side while the price was already stretched.
For example.
| Field | Options | Default | What it changes |
|---|---|---|---|
| Market Type | SPOT FUTURES | SPOT | Which trades to count: Binance spot or futures. - Want trades from people buying the coin itself — SPOT. - Want leveraged trades — FUTURES. On Coinbase and Hyperliquid the switch does nothing: Coinbase is spot only, Hyperliquid is futures only, and the value is set by the exchange automatically. |
| Strategy | Type 1 … Type 6 | Type 1 | A parameter bundle: averaging window length and delta threshold. From Type 1 to Type 6 the window gets longer and the threshold higher. Type 1 is the most sensitive: more marks, including on small spikes. Type 6 is the strictest: only rare, strong spikes. - Want to see small spikes too — Type 1. - Want only rare, strong ones — Type 6. |
| BTC Pairs | ALL USDT ONLY | ALL | Works only on Binance and only for BTC. ALL — the sum of three pairs: BTCUSDT + BTCUSDC + BTCFDUSD. USDT ONLY — the BTCUSDT pair only. For other Binance coins the data is always for the USDT pair; the setting changes nothing. Does nothing on Coinbase and Hyperliquid: bitcoin has one pair there — BTC/USD and BTC/USDC. - Want all of Binance bitcoin — ALL. - Want to compare with a source that counts only BTCUSDT — USDT ONLY. |
| Exchange | Chart Binance Coinbase Hyperliquid | Chart | Which exchange to take data from: Chart — the same one as the chart. Binance — spot and futures, USDT pairs. Coinbase — spot only, USD pairs. Hyperliquid — perpetual futures only, USDC pairs. Coinbase and Hyperliquid are available on paid plans (the “Exchanges” screen). They have candles, trades and the order book. Derivatives, liquidations and loans show “no data” for them. - Want to compare one coin across exchanges — add the indicator several times and pick a different exchange in each. |
Metric COIN MSI. Condition fields:
“Direction” — LONG / SHORT. “BTC pairs” appears only when the coin is BTC.
MSI is the only indicator without a pane. An arrow below the candle (UP) or above it (DOWN) appears when three conditions line up: the trade delta is many times its window average, it is one-sided, and the price is beyond the normal deviation from the average. Strategy is a bundle of averaging window and threshold: from the sensitive Type 1 to the strict Type 6.
Where is MSI drawn?
Correct answer: As marks right on the price chart