 Learn hubBlog
Market Delta.
The indicator shows the deviation from balance between market buyers and market sellers. Its values help assess the state of market supply and demand:
50 means balance (buys and sells are equal).
Above 50 means the market is moving into the overbought zone (buyers dominate).
Below 50 means the market is moving into the oversold zone (sellers dominate).
The indicator is available on the following timeframes: 1D, 4H, 1H, 15M, 5M, 1M.
Indicator variants:
- MARKET DELTA BTC (tracks overbought/oversold conditions for BTC)
- MARKET DELTA ALT (tracks overbought/oversold conditions for the whole altcoin market)
- MARKET DELTA TOTAL (tracks overbought/oversold conditions for the whole ALT+BTC market)
Key points:
On small timeframes (for example, 1M) the values are more volatile and carry less weight.
On large timeframes (for example, 4H-1H) deviations affect long-term trends.
Balance can be reached not only through equal activity of buyers and sellers, but also through trading activity dropping to a minimum. If no one is buying or selling, the algorithm will bring the index back to balance because nothing is affecting it.
To open the indicator:
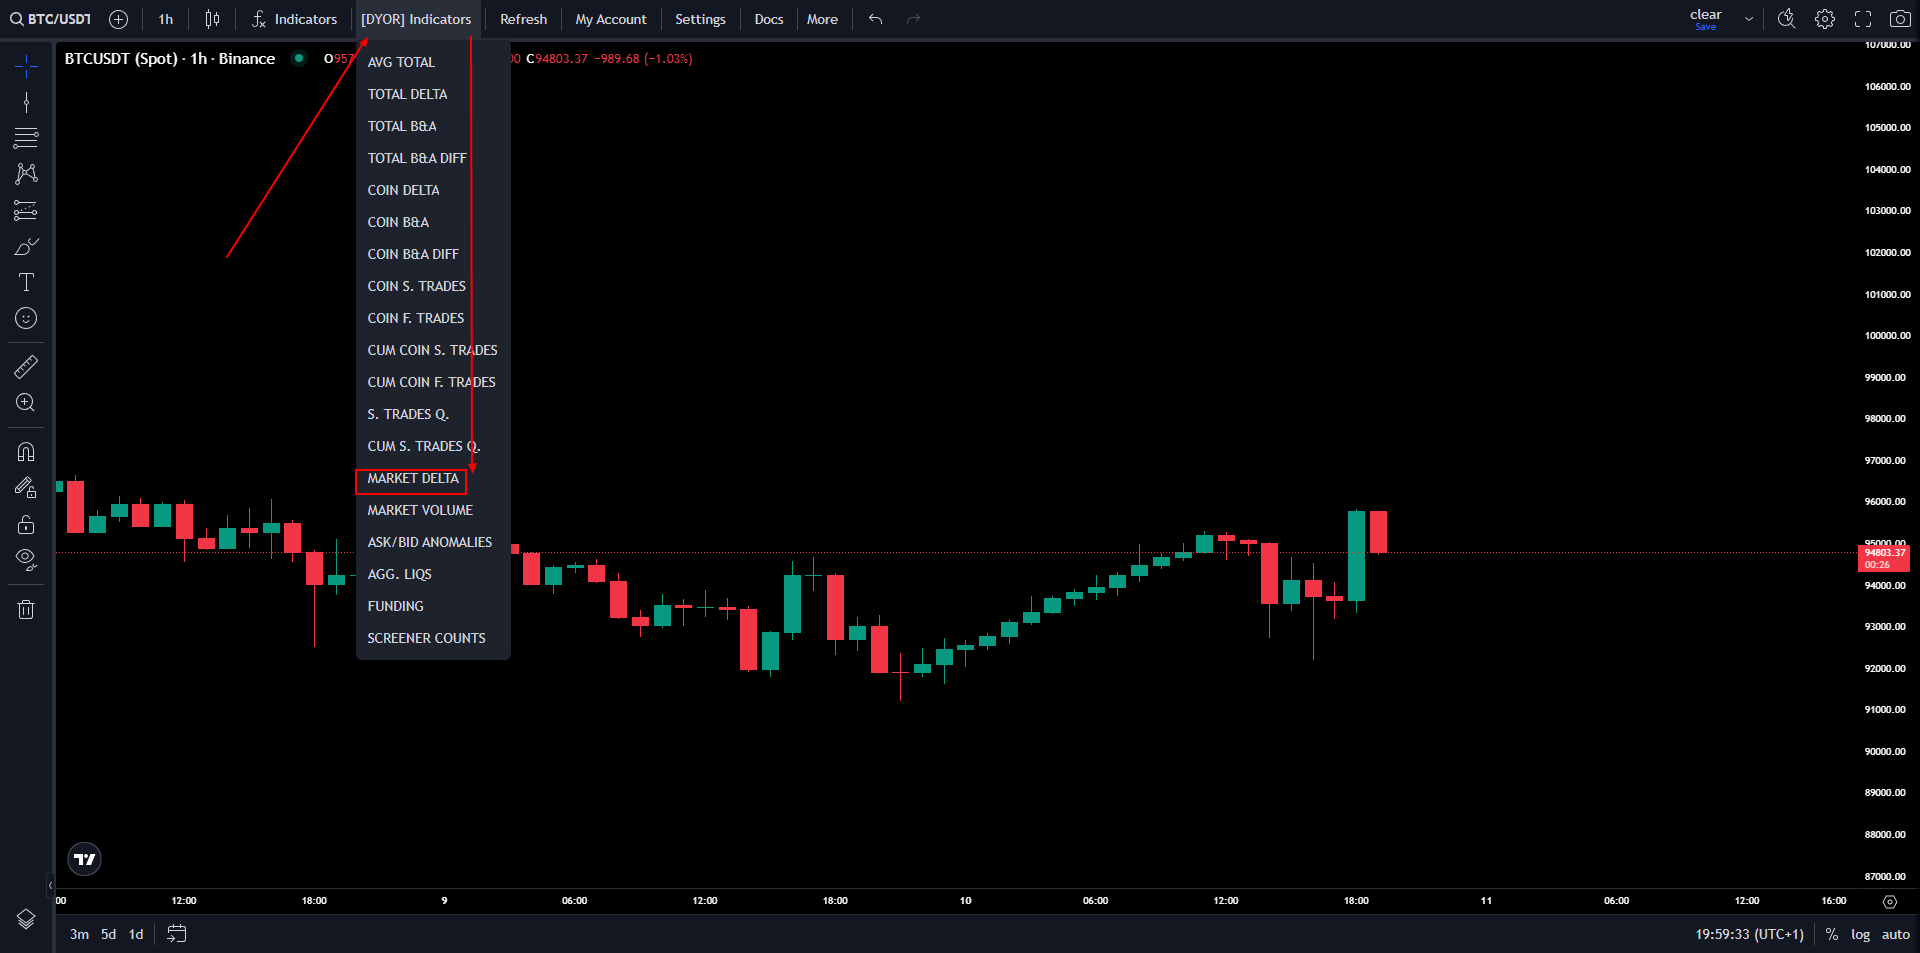
- go to the [DYOR] Indicators menu at the top of Multichart.
- select the MARKET DELTA indicator
To open the indicator settings:
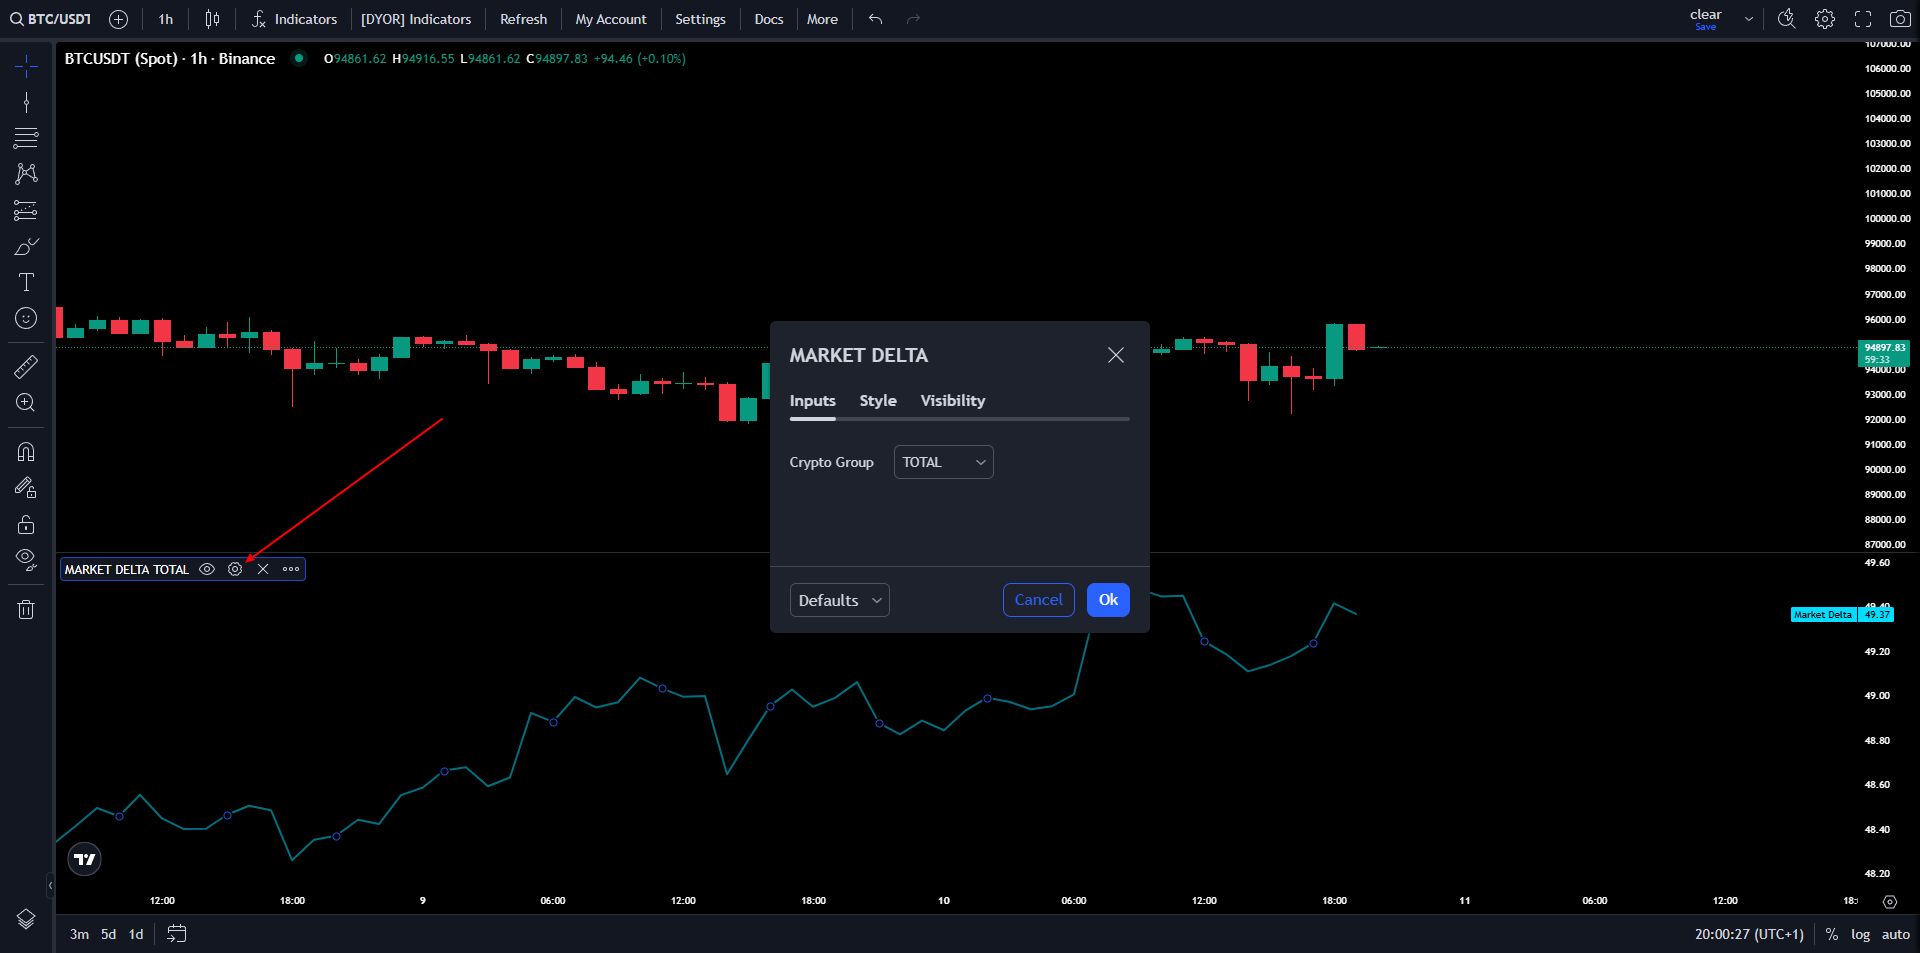
- hover the cursor over the upper left part of the opened indicator
- click ⚙(the gear)
To enable\disable an indicator variant:
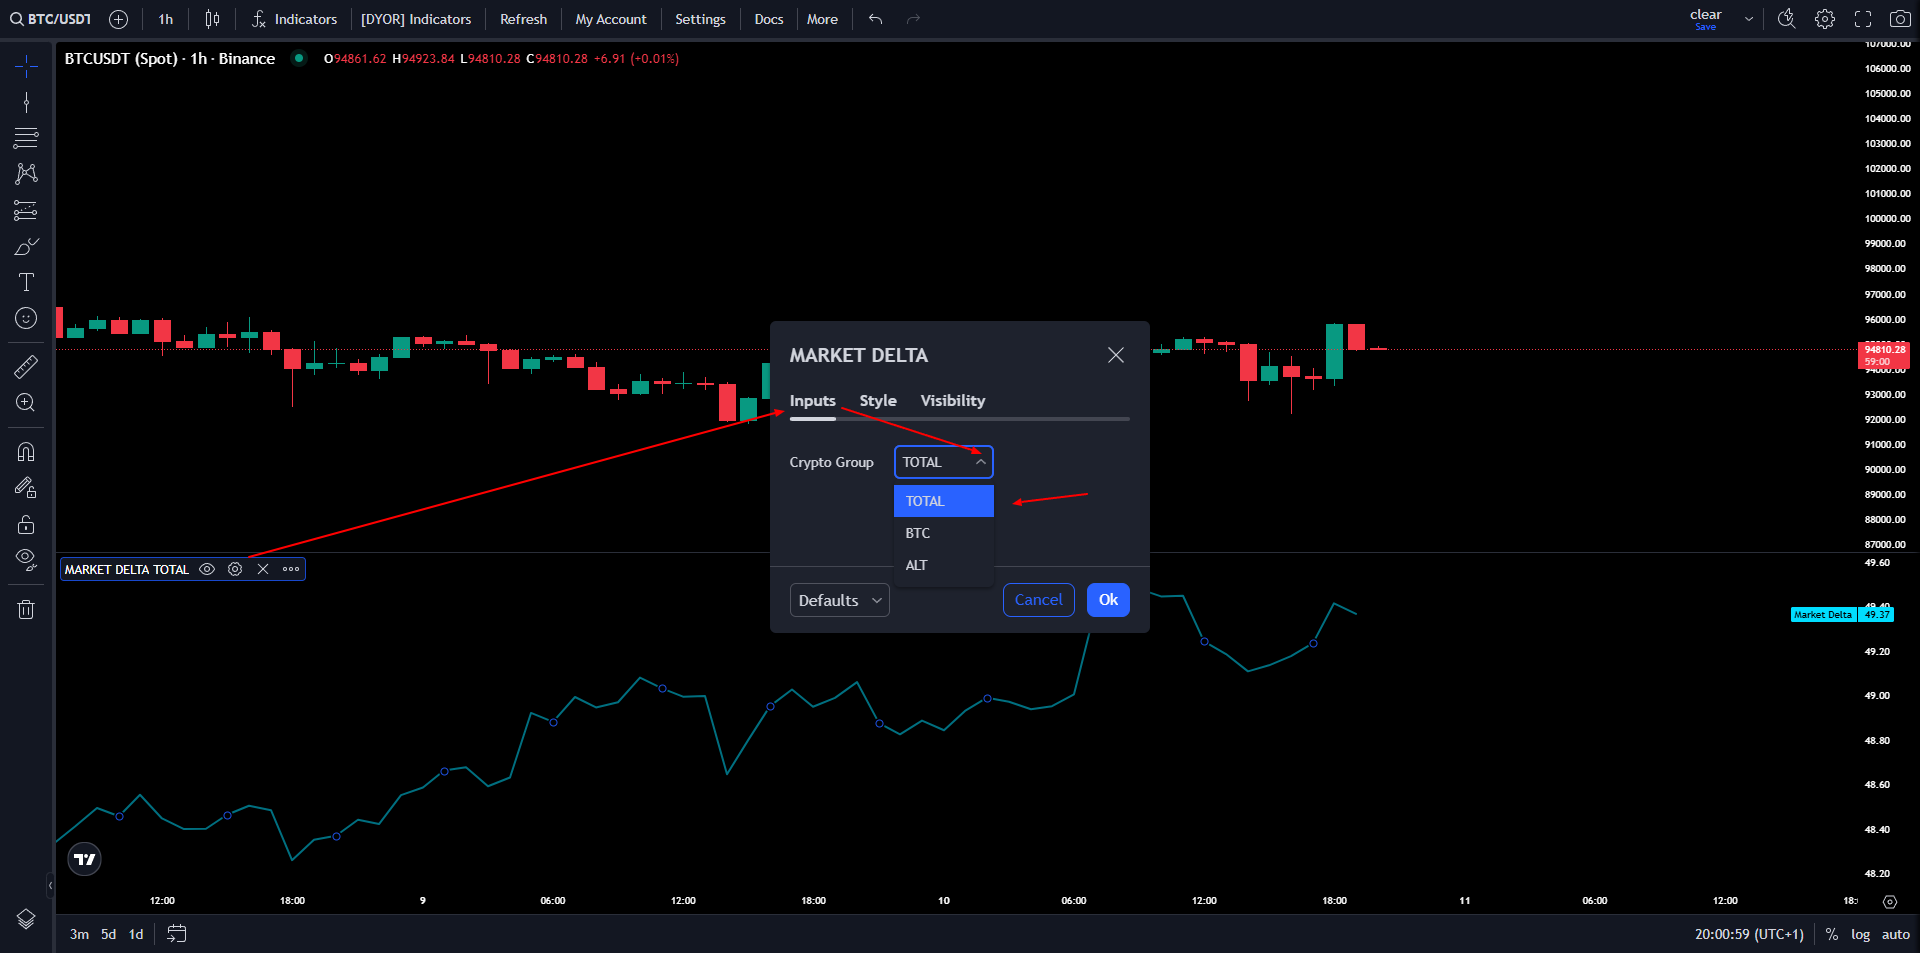
- in the indicator settings that open, click the tab INPUTS
- click the box next to CRYPTO GROUP
- select the indicator variant you are interested in
How to apply Market Delta:
Overbought and oversold zones:
Analyze the indicator's extreme values in historical perspective for each timeframe. For example, on 1H the market may be overbought at values above 52, while on 1M a move at least above 56 can be considered overbought.
Timeframe synchronization:
To confirm signals, look for overlapping overbought/oversold zones on several timeframes.
Price reaction:
Watch how the price reacts as Market Delta moves toward balance (50). The indicator returning to balance can mean lower volatility and market stabilization.
Equilibrium through time:
Remember that balance is reached not only through an active fight between buyers and sellers, but also through a temporary lull in the market. During periods of low trading activity, Market Delta stabilizes around the 50 mark.
Combining with limit indicators:
Use Market Delta together with limit indicators (for example, Total B&A). This lets you assess the interaction between market and limit demand/pressure, producing more accurate forecasts.
Market Volume.
The indicator shows aggregated trading volumes for the selected time interval (timeframe).
It helps assess overall activity in the crypto market by reflecting the volumes involved in trades, with the option to analyze either the entire market capitalization (Total) or bitcoin (BTC) separately. Values are displayed in BTC.
Key characteristics:
Trading volumes: Reflects the real volumes of trades executed on top exchanges.
Display setting: The option to choose between "Total" (total volume) and "BTC" (trading volume for Bitcoin only).
Scale: Values are shown in bitcoins for clarity.
Available timeframes: 1D, 4H, 1H, 15M, 5M, 1M.
How to open the indicator:
Open the [DYOR] Indicators menu.
Select the "MARKET VOLUME" indicator.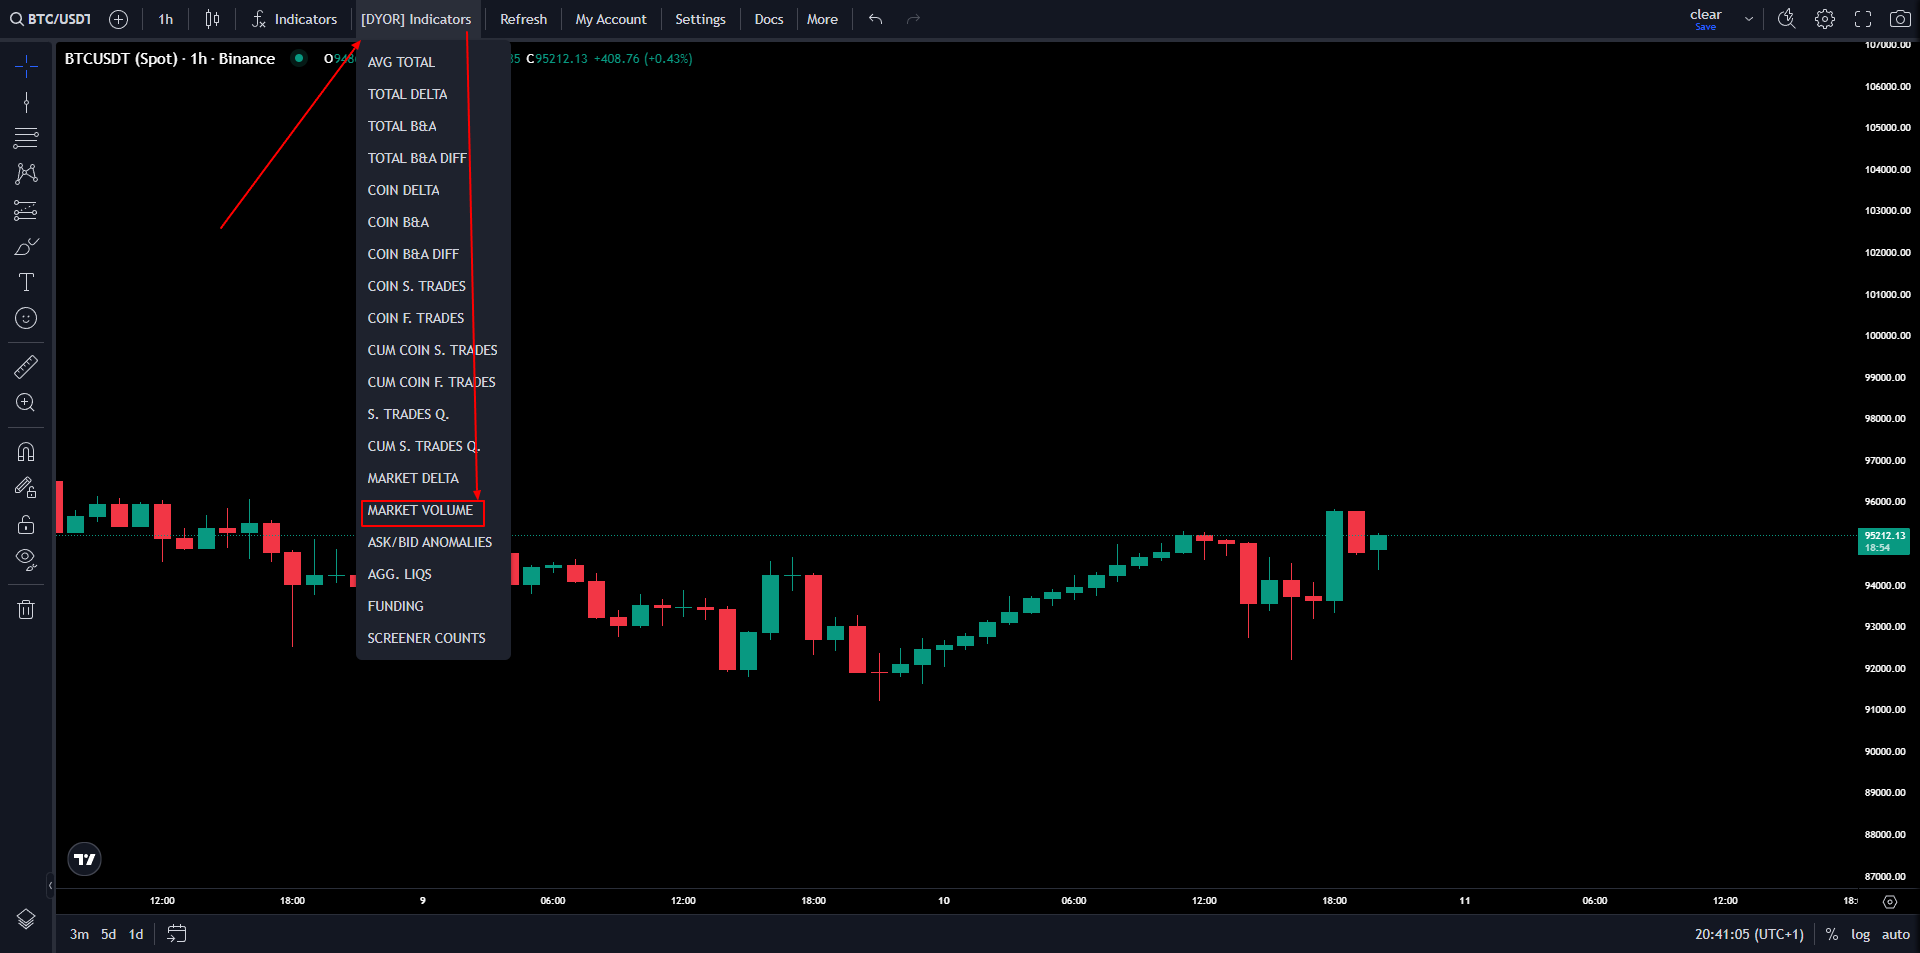
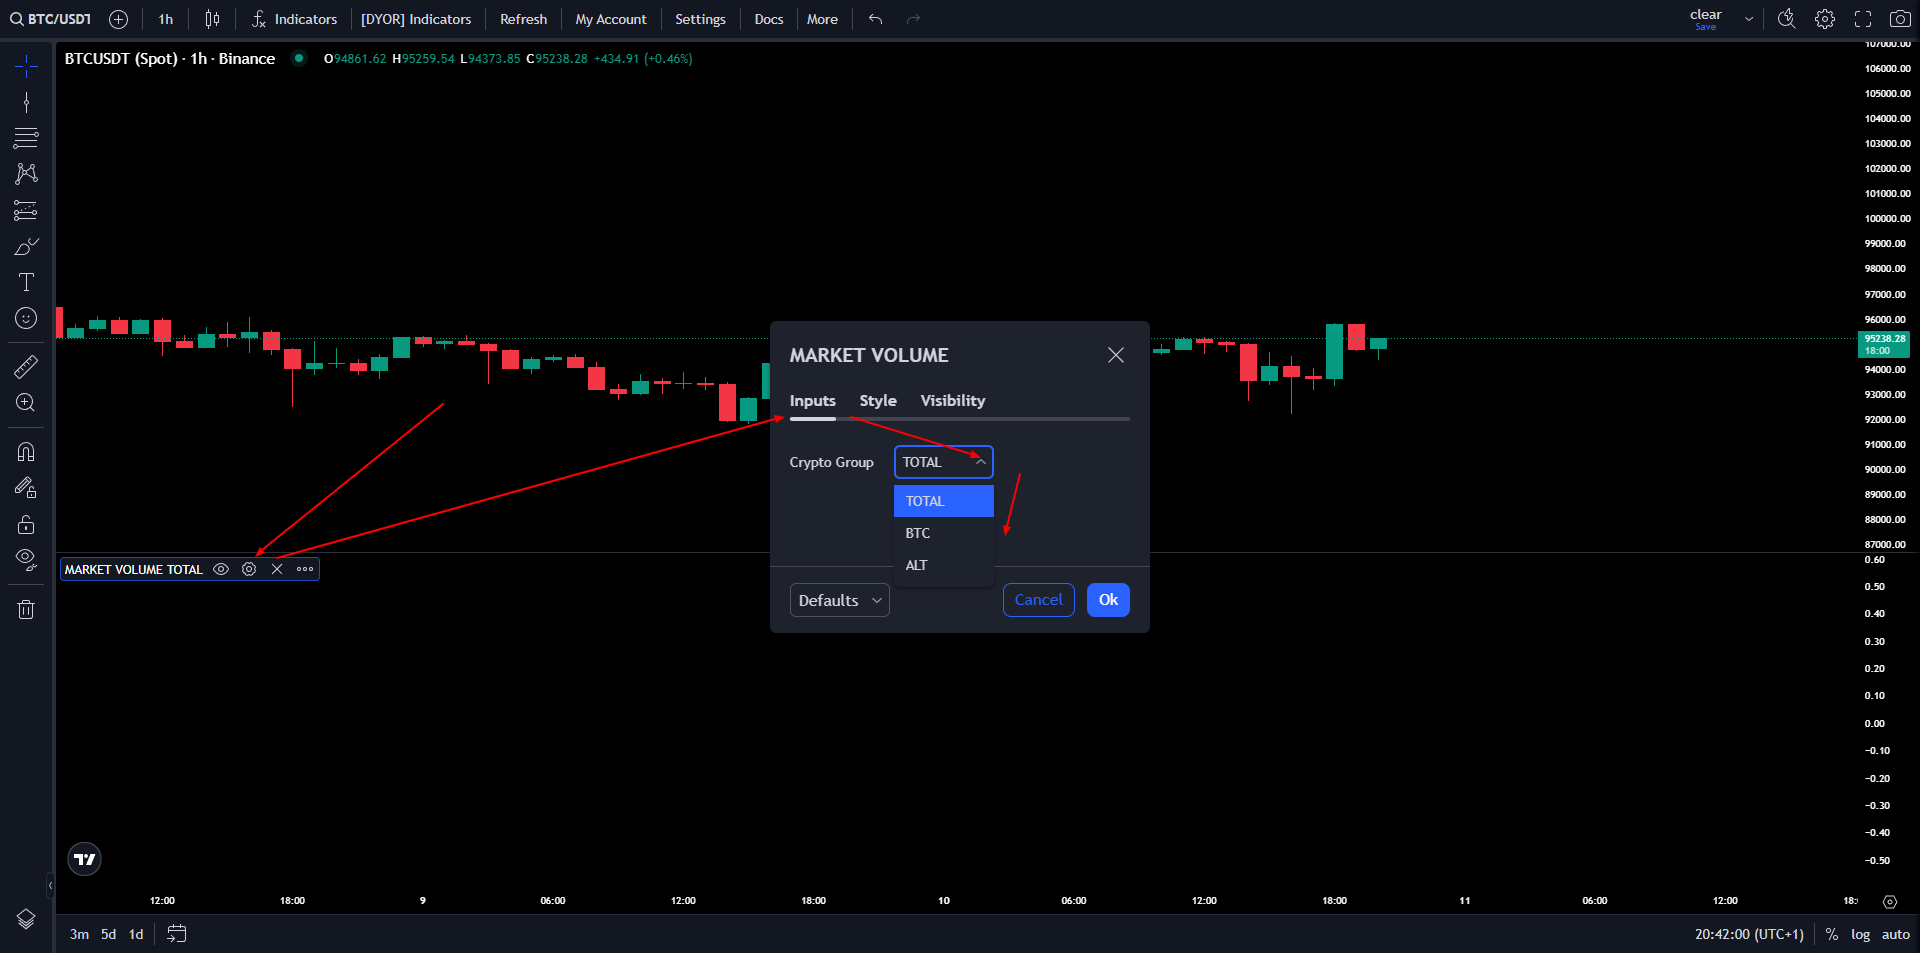
Configuring the indicator:
Hover the cursor over the upper left corner of the opened indicator.
Click ⚙ (the gear).
Switch the display between "Total" and "BTC" in the GROUP CRYPTO section.
Key points:
On higher timeframes (for example, 4H-1H) the indicator is most objective.
On lower timeframes (1M or 5M) Market Volume is more sensitive to local spikes in activity, which may not always lead to a correct assessment of the situation.
Significant changes in trading volume often signal upcoming price moves.
Using the Market Volume indicator:
Trend analysis:
A sharp increase in volume can point to the current trend strengthening or reaching its climax. If growing volume is accompanied by price movement, the trend is likely to continue.
Spotting reversals:
Falling volume is often an interesting moment to look for an imbalance using the limit and market indicators - it often precedes significant market moves. The Market Volume indicator is an important tool that shows the most favorable time to look for an imbalance.
Which Market Delta value corresponds to a state of market balance?
Correct answer: 50
How should you use Market Delta to forecast price movement?
Correct answer: Wait for overbought/oversold zones to sync across several timeframes.
What does a rise of the Market Delta value above 51 on the 1H timeframe mean?
Correct answer: Market buyers dominating the market.
🎉 Congratulations! 🎉
You have successfully completed the lesson on MARKET DELTA and MARKET VOLUME!