 Learn hubBlog
S. TRADES Q.
An indicator that calculates the market delta by the number(not to be confused with volume) of trades executed on spot.
If 1000 sell orders and 3000 buy orders were executed within one minute.
Trade count delta = positive, buy order surplus = 2000 orders.
In this case the green bar will point upward.
If more was sold during the minute, the bar will point down, showing how many more sell orders there were.
Example in the screenshot: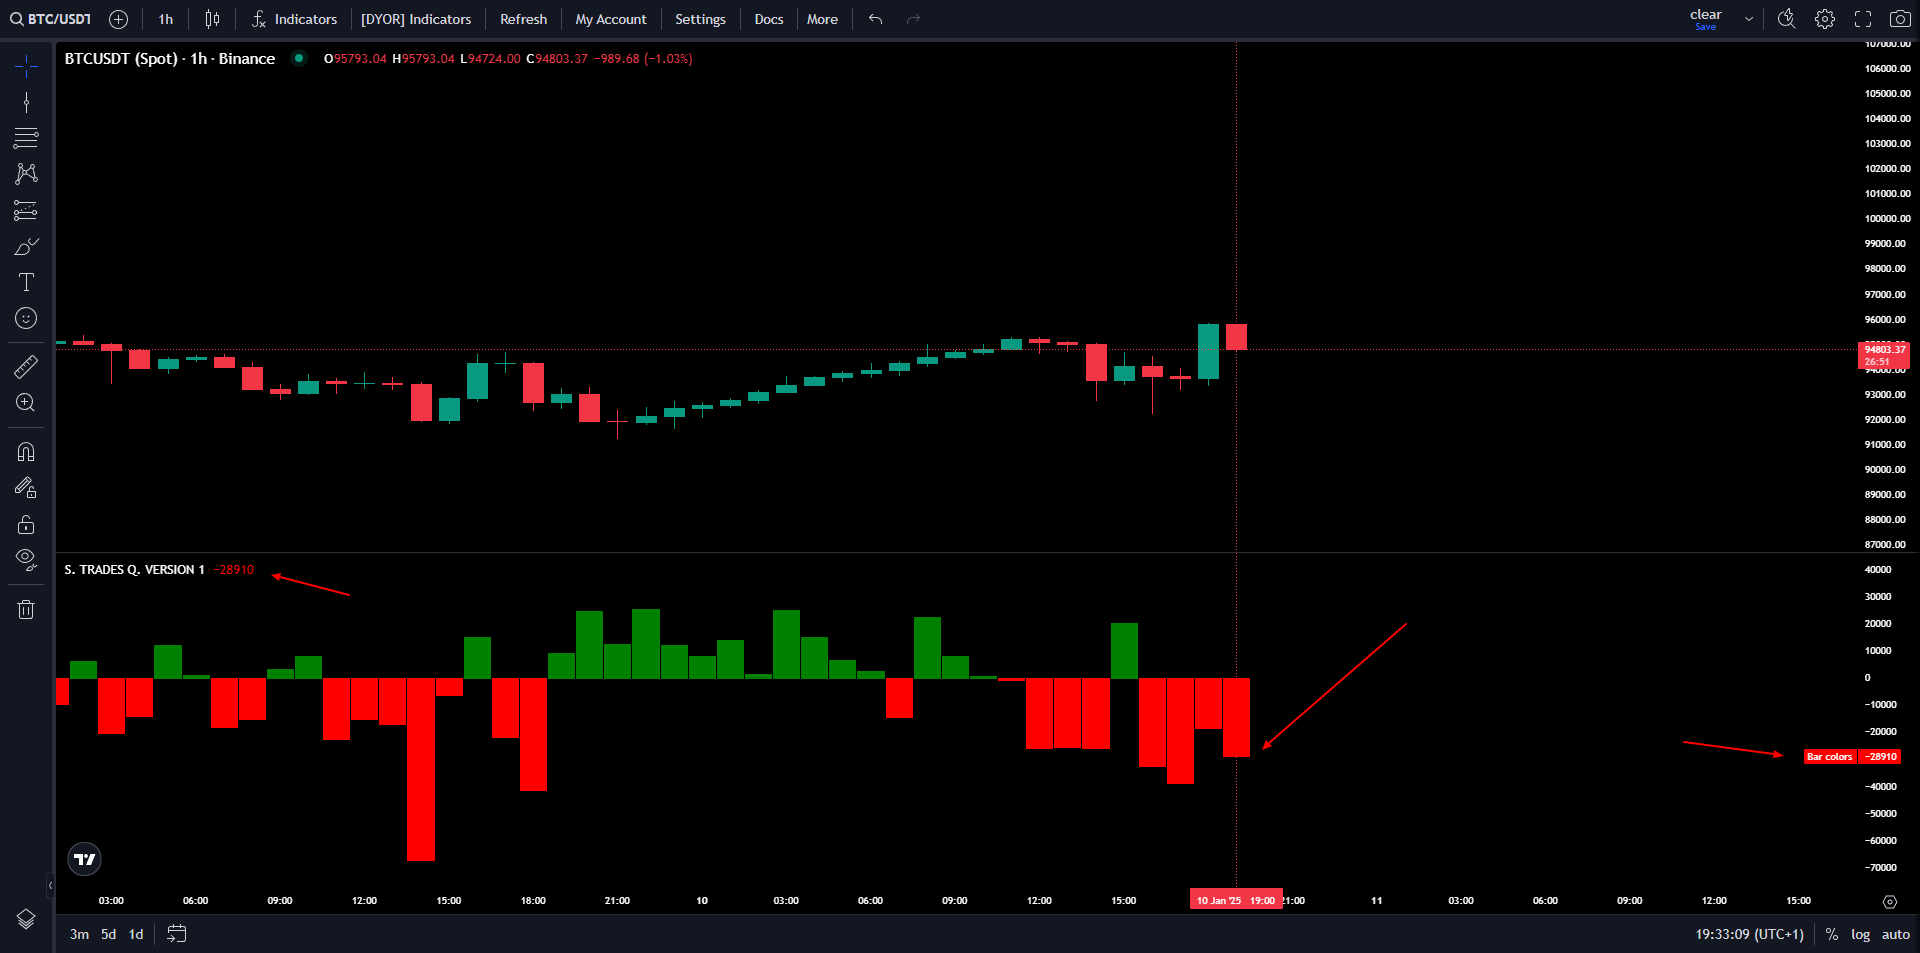
The last bar is red and has a value of -28910, this means that over the current hour (given the selected timeframe) there were 28910 more sell orders.
CUM S. TRADES Q. An indicator that calculates the cumulative market delta based on the number of trades executed on spot.
Indicator activation option #1:
hover your cursor over the chart at any point you are interested in
click the right mouse button
in the pop-up menu click - calculate cumulative delta
*the cumulative delta will be calculated from the specified time to the current time
Indicator activation option #2:
next to the indicator's name in the added indicators panel, click ⚙ (the gear)
click inputs
enter the start time for the cumulative market delta calculation
*the cumulative delta will be calculated from the specified time to the current time
Usage recommendations:
Combine data from S. TRADES Q. and COIN S. TRADES to get the full picture.
Pay attention to divergences between the number of trades and the volumes, as this can be a signal pointing to a trend change.
Use it together with the cumulative delta indicators to assess long-term trends.
These indicators are especially useful for scalping and analyzing markets with low liquidity.
An example of combining it with COIN S. TRADES:
Suppose you are analyzing the BTC asset:
S. TRADES Q. shows that the number of buy trades exceeds the number of sell trades (a surplus of 2000 trades - green bar).
COIN S. TRADES at the same time shows that sell trade volume is significantly higher (for example, a $10 million surplus).
Conclusion: small buyers are active on the market, but large participants (whales) are selling. This can point to a hidden bearish tendency despite the positive trade count delta.
🎉 Congratulations! 🎉
You have successfully completed the lesson on CUM S. TRADES Q. and S. TRADES Q.