 Learn hubBlog
Cover the “Compare two metrics” mode: operations on a pair and normalization.
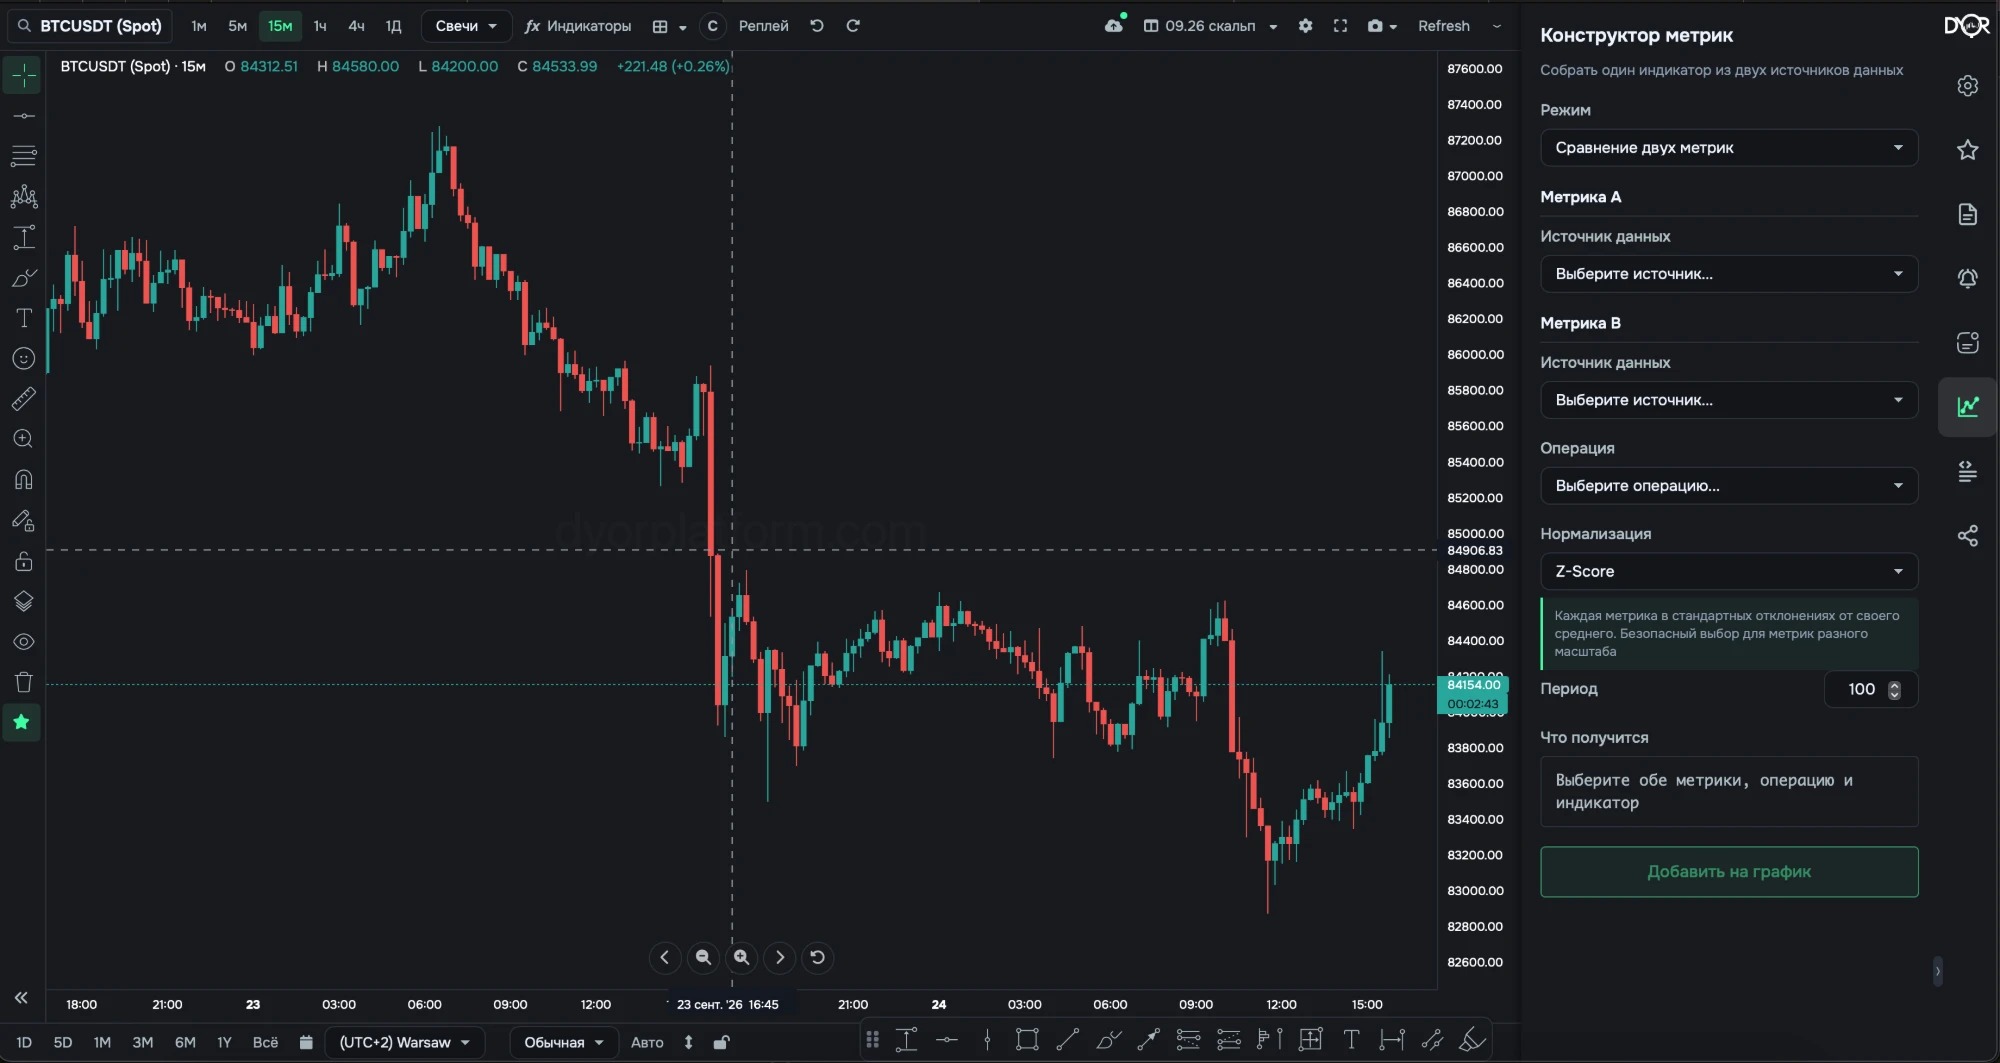
Two metrics in one line.
The second layer of the same idea. In “Single metric” mode the formula asks one number a question. Here it asks about the link between two numbers: spot to futures, bids to asks, OI to price. There's no such metric in the indicator list; you build it yourself. On top — the same normalization: how unusual the link is now relative to its own history.
Link two values on one scale: near bids with far asks, spot with futures, OI with price.
For example.
Right rail → Metrics Builder → mode Compare two metrics.
| Field | Options | Default | What it changes |
|---|---|---|---|
| Metric A, Metric B | any two sources | — | What to compare. Each is built as in “Single metric” mode. |
| Operation | 10 options, table below | — | How to combine A and B into one number. |
| Normalization | No normalization Z-Score Percentile | Z-Score | Bring both metrics to one scale over a 100-bar window: Z-Score — how many standard deviations the value has moved from its window average: 0 — as usual, ±2 — rare, ±3 — very rare. Percentile — what percent of values in the window are below the current one: 50 — the middle, 95 — almost the maximum. - Want to compare metrics of different scale — Z-Score, the safe choice. - Want robustness to outliers — Percentile. No normalization — only if both metrics are already on one scale. |
| Stability | off on | off | Show the operation's stability instead of its value, from 0 to 100. The window is split into sub-windows (4 by default), and the operation is computed in each one anew. The answer is the share of sub-windows where the direction matched the direction over the whole window. Dead zone and neutral are set in the operation's units. |
| Indicator | as in “Single metric” mode | Z-Score | A classic indicator on top of the result, with its own parameters, e.g. period 20. |
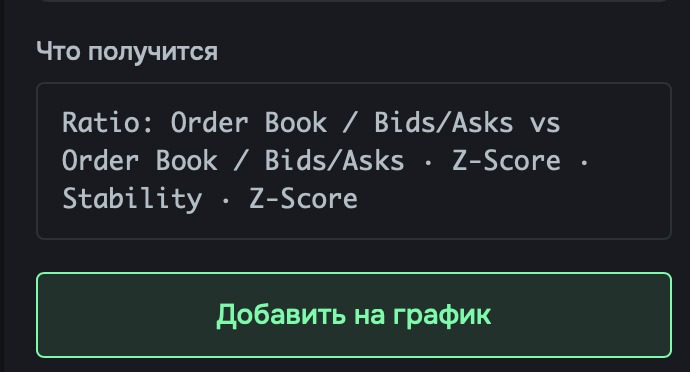
| Preview | preview | — | The build in one line: operation, sources and fields, normalization, stability, indicator. Then “Add Indicator”. |
Operations
| Operation | Formula | What it shows |
|---|---|---|
| Divergence | A − B | How far the metrics diverged, with sign. |
| Divergence Abs | |A − B| | The gap between A and B, without direction. |
| Composite | A + B | Total pressure when both metrics point the same way. |
| Alignment | A × B | Plus — both point the same way. Minus — conflict. |
| Ratio | A ÷ B | Ratio of A to B. |
| Relative Divergence | A − B divided by the size of A and B | Divergence relative to the combined size, from −1 to +1. |
| Divergence Momentum | ΔA − ΔB | Which metric is moving faster right now. |
| Correlation | correlation of ΔA and ΔB | Pearson correlation of increments over the period (100 bars), from −1 to +1. |
| Spearman IC | rank correlation of A with future B | Does A lead B. B is usually the price (the “Price” source). Each bar pairs A from horizon bars back with the change in B since then. From −100 to 100: plus — high A precedes a rise, minus — a fall. |
| Tail Edge | average move of B after A's tails | What B does after extreme values of A: the move after the upper tail minus the move after the lower one, in percent. Low N / High N in the legend — how many bars each tail collected. |
Spearman IC and Tail Edge parameters
| Field | Options | Default | What it changes |
|---|---|---|---|
| Horizon (bars) | 1 … 500 | 12 | How many bars ahead to look at B's move. |
| Window (bars) | 12 … 2000 | 500 | Over how many bars to collect pairs. |
| Min samples | 3 … 1000 | 12 | With fewer pairs the value isn't computed. Spearman IC only. |
| Low tail (A ≤), High tail (A ≥) | bounds | 5 and 95 | A's tail bounds after normalization. Tail Edge only. |
| Min tail samples | 1 … 1000 | 10 | A thin tail gives no number. Tail Edge only. |
With Z-Score the pane gets levels ±3, ±2, 0. With Percentile — 95 / 75 / 50 / 25 / 5. The levels always stay in the pane's view; to turn this off, use “Levels in autoscale” in the indicator menu.
The normalization window boundary on the chart is shown by the Bars Back Lines indicator (indicators window → TECHNICAL → Overlays). It draws up to four vertical lines N bars back from the current one. Zero in a field turns a line off.


Yes, via the Metric pair entry in the “Metric” list: the same Metric A / B, operation and normalization. Covered in the “Alerts” block.
Two metrics are joined by an operation: difference, sum, product, ratio, correlation and others. The result is normalized so dollars and percent land on one scale. Z-Score — how many deviations from its own average. Percentile — its place in its own history over 100 bars. It's your own indicator from two sources: a link that isn't in the ready-made list, and an answer to how unusual it is now.
Why does comparing two metrics need normalization?
Correct answer: To bring metrics with different units to one scale