
DYORLearn hubBlog
Home / Learn hub / Metrics Builder

Metrics Builder: single metric

7 min · DYOR Education
PRORight rail
Goal

Cover the Metrics Builder in “Single metric” mode: source, field, indicator, adding to the chart. And why compute a formula on top of data that's already visible on the chart.
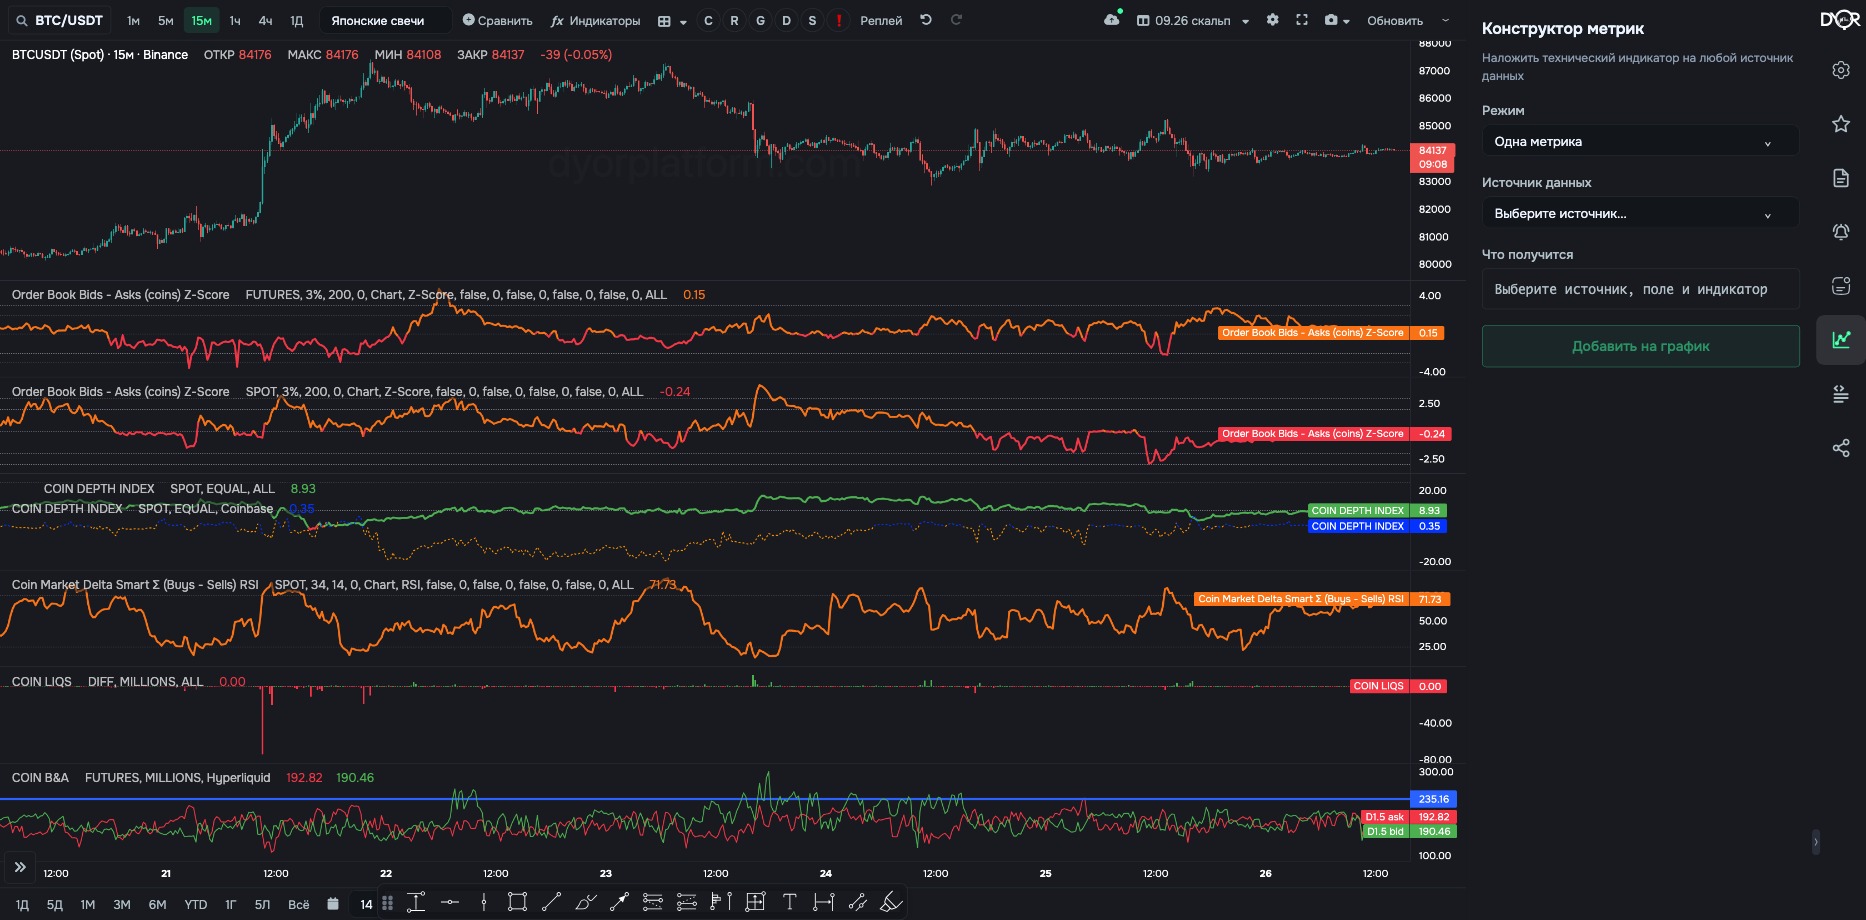
Metrics Builder: data source, field, indicator, “Preview”
What it shows

A technical indicator on top of any DYOR data. In essence, your own indicator, built in the interface without code.

  • take a source — order book, trades, OI, funding, liquidations, loans, market cap, Depth Index, coin price and others, almost thirty in all;
  • a field from it;
  • apply a classic indicator: SMA, EMA, WMA, RSI, Std Dev, ROC, Bollinger Bands, MACD, Percentile, Z-Score, Cumulative Sum, Lowest, Highest, Range, Percent Rank. Or Raw — no processing.

The result is a pane on the chart, like a regular indicator.

Why bother if DYOR indicators already exist. A regular indicator shows the current picture in the data: how many dollars sit in the order book, how many contracts are in OI. That's the raw value. A formula on top of it asks the same number a different question. How unusual is it for the last N bars — Z-Score, Percentile. How fast did it change — ROC, RSI. What corridor does it move in — Bollinger Bands. That's how a local anomaly shows up in data that looks flat. And the other way round: a spike on the raw line turns out to be normal for this coin.

A live example. BTC/USDT, 1h, asks 3% on spot, September 20, 03:00.

  • Raw line: 72.9M. Over the last 100 hours asks ranged from 39M to 97M, median 64M. 72.9M is the middle, nothing catches the eye. Percentile(100) = 56.
  • Z-Score(20) on the same data: −3.5. For twenty hours before that, asks held at 83–95M, 87M on average. In one hour 15M was pulled — the sharpest drop in ten days.
  • One number, three answers. Raw — “normal”. Percentile over 100 bars — “normal”. Z-Score over 20 bars — “very rare”. Different formulas and different windows ask different questions.

The anomaly here is a fact about the current bar: the value is rare for the last N bars. It doesn't say where the price goes next.

asks 3%, raw value, $M72.9 — mid-range over 100 hourssame data, Z-Score(20)0−2−3.5 — sharpest drop in ten days
One number, two answers. Raw — “normal”, the formula on top — “very rare”. That's the whole point of the builder.
What it's for

Ask the data your own question instead of the raw value: smooth it, measure the speed, find a local anomaly. It's your own indicator, written in the DYOR interface without code. A tool for those who know what they want to compute.

For example.

  • Z-Score(20) on asks 3% — the moment asks were pulled sharply relative to the last 20 hours, even if the dollar value is ordinary.
  • Percentile(100) on spot trade volume — the current hour against the last hundred. BTC/USDT, 23.09 14:00: volume 463M against a median of 73M, Percentile 98 — almost the maximum in four days.
  • RSI(14) on bids 3% — how fast bids are being added. BTC/USDT, 23.09 15:00: RSI 79, bids 92.6M — the maximum in a hundred hours.
  • MA(20) on COIN TRADES — smoothed trade delta instead of columns. RSI on Binance OI — how fast positions are being built relative to recent bars.
Where to find it

Right rail → Metrics Builder. Mode: Single metric.

Settings
  • Data Source — where to take the numbers from. Next to it, Source Settings: market, depth, Total Type for total sources (TOTAL / TOTAL2 / TOTAL3 / OTHERS / TOTAL (-STABLE)), BTC pairs for bitcoin.
  • Field — which exact value of the source to take.
  • Indicator and its Parameters, e.g. period.
  • Preview — shows the result. Then Add Indicator.
  • After adding, the pane parameters get Timeframe (Chart / 1m … 1d) and Color Threshold — the threshold at which the color changes.
In alerts

Yes, via the Composite metric entry in the “Metric” list. It's the same builder inside the condition form. That's how sources not directly in the list get into alerts: market cap, market-wide Depth Index and others. The “Exchange” field in this form is actually the market type, Spot or Futures: the exchange here is always Binance.

Try it yourself
  1. Right rail → Metrics Builder. Source Order Book, field Asks ($), Depth 3%, indicator Z-Score, period 20.
  2. Add it to the chart and find the bar with the lowest value of the week.
What you should get. You found the hour when asks were pulled hardest relative to the last 20 hours — something you can't see on the raw line.
Paid feature.
Takeaway

The builder applies a classic indicator to any DYOR data: source → field → indicator → “Add Indicator”. A regular indicator shows the raw value. A formula on top of it answers a different question: how unusual the value is for the last N bars, how fast it changes, what corridor it moves in. Flat-looking data reveals a local anomaly, and a spike on the raw line turns out to be normal for this coin. It's your own indicator without code, for those who know what to compute. An anomaly is a fact about a bar, not a direction forecast. Via the “Composite metric” alert metric, the same builder works in alerts. That's how sources not directly in the list get there, e.g. market cap and market-wide Depth Index.

Quick check

Asks 3% on BTC/USDT are 72.9M, mid-range over 100 hours. Z-Score(20) shows −3.5. What does it mean?

Show answer

Correct answer: For the last 20 hours asks held noticeably higher, and within an hour they were pulled sharply

Quick check

Percentile(100) = 56 and Z-Score(20) = −3.5 on the same bar. Why are the answers different?

Show answer

Correct answer: Different windows and different formulas: over 100 bars the value is ordinary, over 20 it's a sharp drop

← Previous lesson Next lesson →
See these concepts live on real Binance data — the DYOR workspace is free to start.
Open DYOR Platform