 Learn hubBlog
Take apart OPTIONS GEX — how many forced hedging trades a 1% price move will cause.
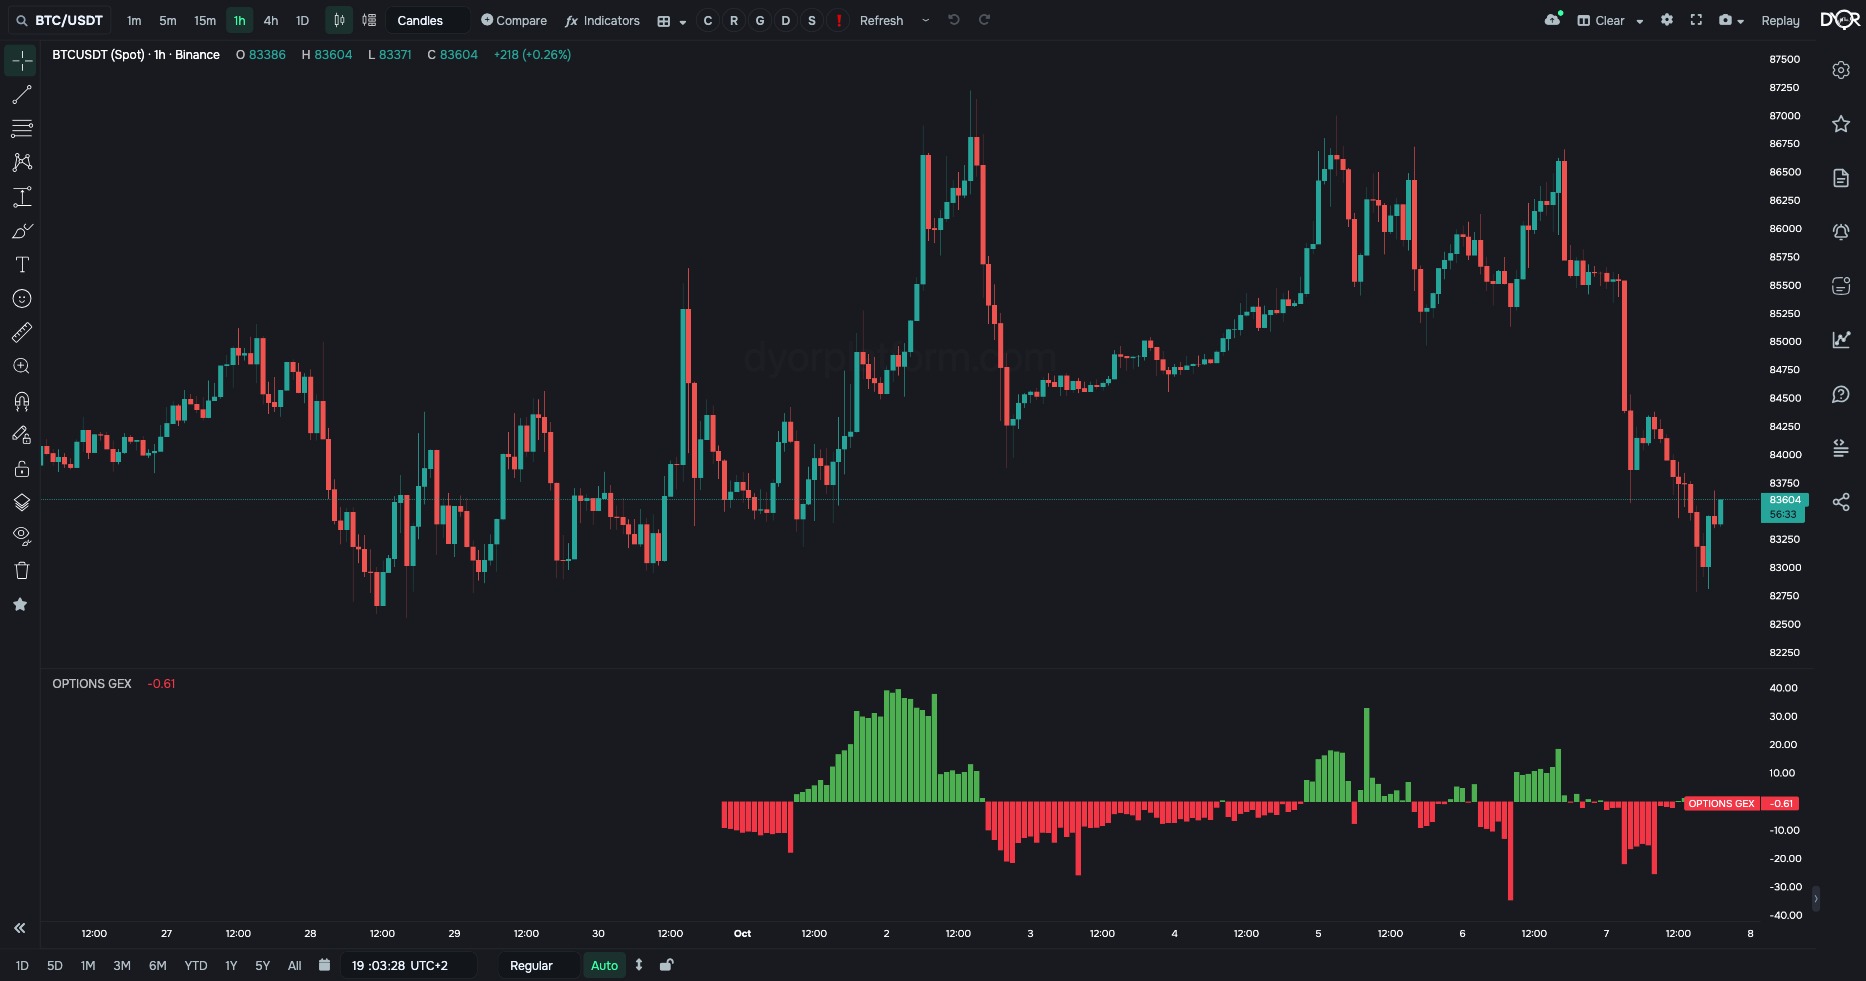
How many forced trades a price move will cause.
This is the most complex indicator. We go step by step.
1. Who is on the other side. In many options trades the other side is a market maker. That is a professional who earns on the difference between buy and sell prices, not on guessing direction.
2. The hedge. To not depend on the price, the market maker covers the risk with an opposite trade in futures. How much BTC that takes is told by the option’s delta.
3. The hedge has to be adjusted. Example: the market maker sold that same 90,000 call. The price moved — the delta changed — he buys more or sells.
| BTC price | Call delta | BTC held in the hedge | What he did |
|---|---|---|---|
| 86,000 | 0.28 | 0.28 | — |
| rose to 89,000 | 0.44 | 0.44 | bought 0.16 BTC more |
| fell to 83,000 | 0.10 | 0.10 | sold 0.18 BTC |
He bought on the rise and sold on the fall. Not because he wanted to: the calculation requires it. These are forced trades.
4. Gamma. It shows how much delta changes with each price move. In the table delta went from 0.28 to 0.44 — that is gamma at work. Big gamma — many forced trades.
5. In which direction. It depends on whether the market maker has bought or sold the option.
| The market maker’s option | Price rises | Price falls | What it does to the price |
|---|---|---|---|
| Sold | buys | sells | accelerates it |
| Bought | sells | buys | slows it down |
What the indicator counts. GEX is gamma exposure. It adds up the gamma of all open options and converts it into money: how many millions of dollars of hedge will move if the price moves 1%. Calls go with a plus sign, puts with a minus sign. On the chart — bars: green above zero, red below.
How it is usually read. With a plus the hedge goes against the move, and the price behaves more calmly. With a minus the hedge goes with the move, and the jumps are sharper. This reading rests on an assumption: the market makers’ calls are bought and their puts are sold. The indicator does not check the assumption. It only shows the sum.
Formula: gamma × open interest × price² × 1%, summed over all options. BTC on 1 October 2026: Binance — $26.24 m per 1%, Deribit — $253.88 m per 1%.
See how many forced hedging trades a 1% price move will cause and which way they will go.
For example.
| Field | Options | Default | What it changes |
|---|---|---|---|
| Exchange | Chart | Chart | Cannot be switched for options indicators: there are no other values in the list. The options exchange is chosen by the “Options exchange” field below. |
| Options exchange | Binance Deribit | Binance | Whose options to count. The chart’s exchange does not affect this: the indicator takes only the coin from the chart. - Want Binance options — Binance. - Want the main options exchange, with 19 times more BTC open interest — Deribit. |
Metric OPTIONS. Condition fields:
“Options exchange” — Binance or Deribit. “Options metric” for this indicator: Net GEX ($ per 1%). The “Exchange” and “Market type” fields are in the form, but the options asset is taken from the coin.
GEX adds up the gamma of all open options and converts it into millions of dollars per 1% move. Above zero — the gamma of calls outweighs, below — of puts. The reading “plus slows down, minus accelerates” rests on an assumption the indicator does not check.
GEX is above zero. What does it mean?
Correct answer: The gamma of calls outweighs