Goal
Understand what a regular candle doesn't show and what data DYOR adds under the chart.
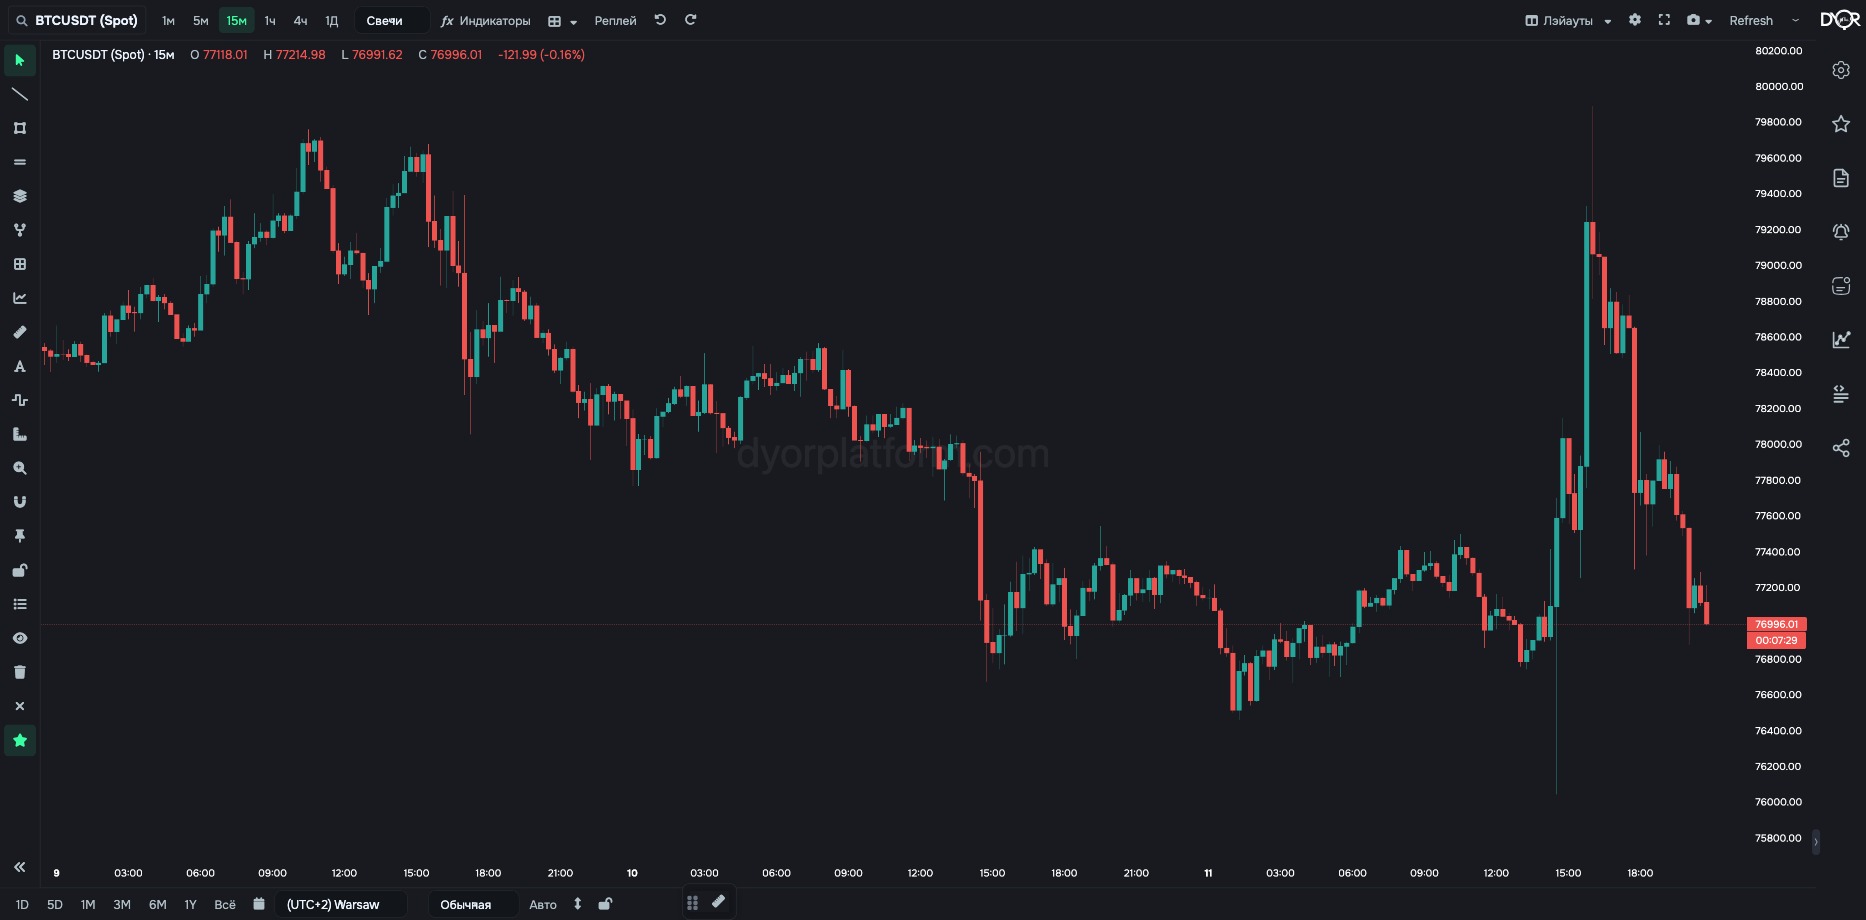
BTC/USDT, 15m: candles only
A candle shows one thing: the prices at which trades happened. A candle doesn't show:
- how much money was waiting to buy and to sell near the price;
- who bought and sold at market;
- how many positions are open with leverage;
- who got force-closed.
DYOR records this data every minute and draws it as panes under the chart:
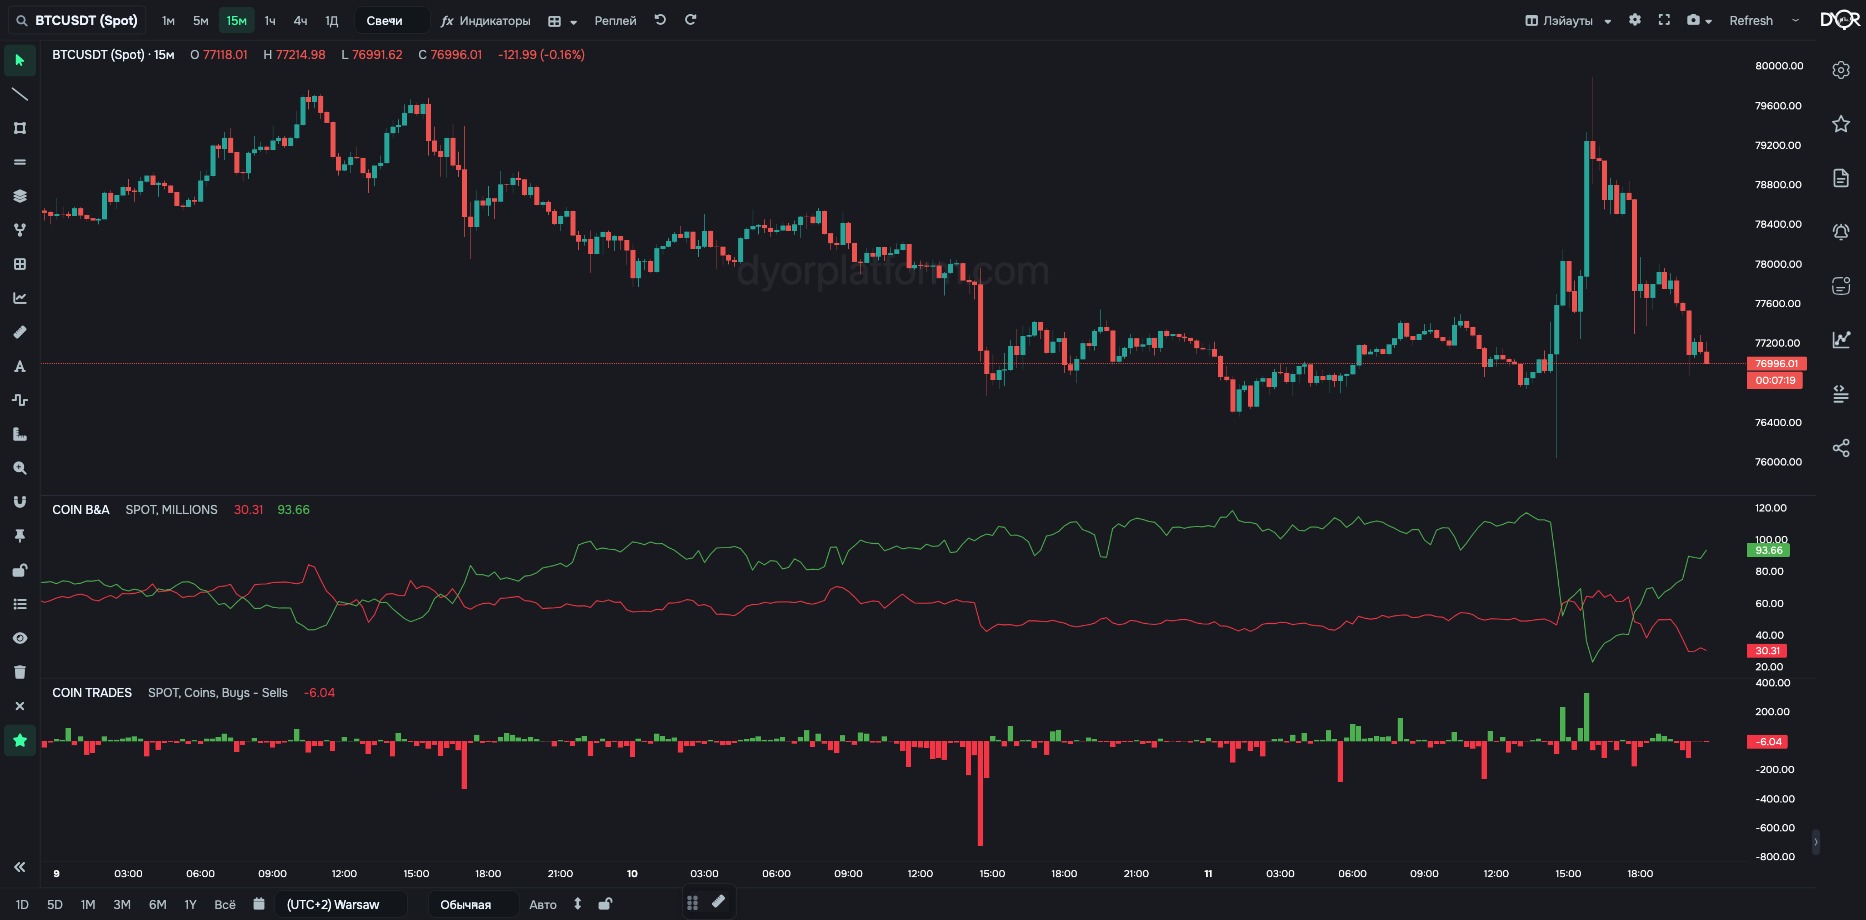
The same chart with two DYOR panes: COIN B&A (orders in the order book) and COIN TRADES (market buys and sells)
- Order book — how much money sits in limit orders at seven distances from the price.
- Trades — how much was bought and sold at market, in money and in number of trades.
- Futures — open interest, funding, longs versus shorts, liquidations.
- The whole market — the same, summed across all coins (TOTAL).
- Alerts — any of this can be set as a condition and delivered to Telegram.
The course is 45 screens, about 45 minutes. Every screen follows the same structure: goal → what it shows → what it's for → where to find it → settings → how to put it in an alert → takeaway. The course does not teach you how to trade.
Takeaway
A candle shows only the price. DYOR shows what the price is made of: orders in the order book, market trades, leveraged positions, liquidations. All of it is available per coin and for the whole market. You can set an alert on any of it.
 Learn hubBlog