 Learn hubBlog
Understand AGG. FUNDING — how many coins in the market fall into each of the four rate categories.
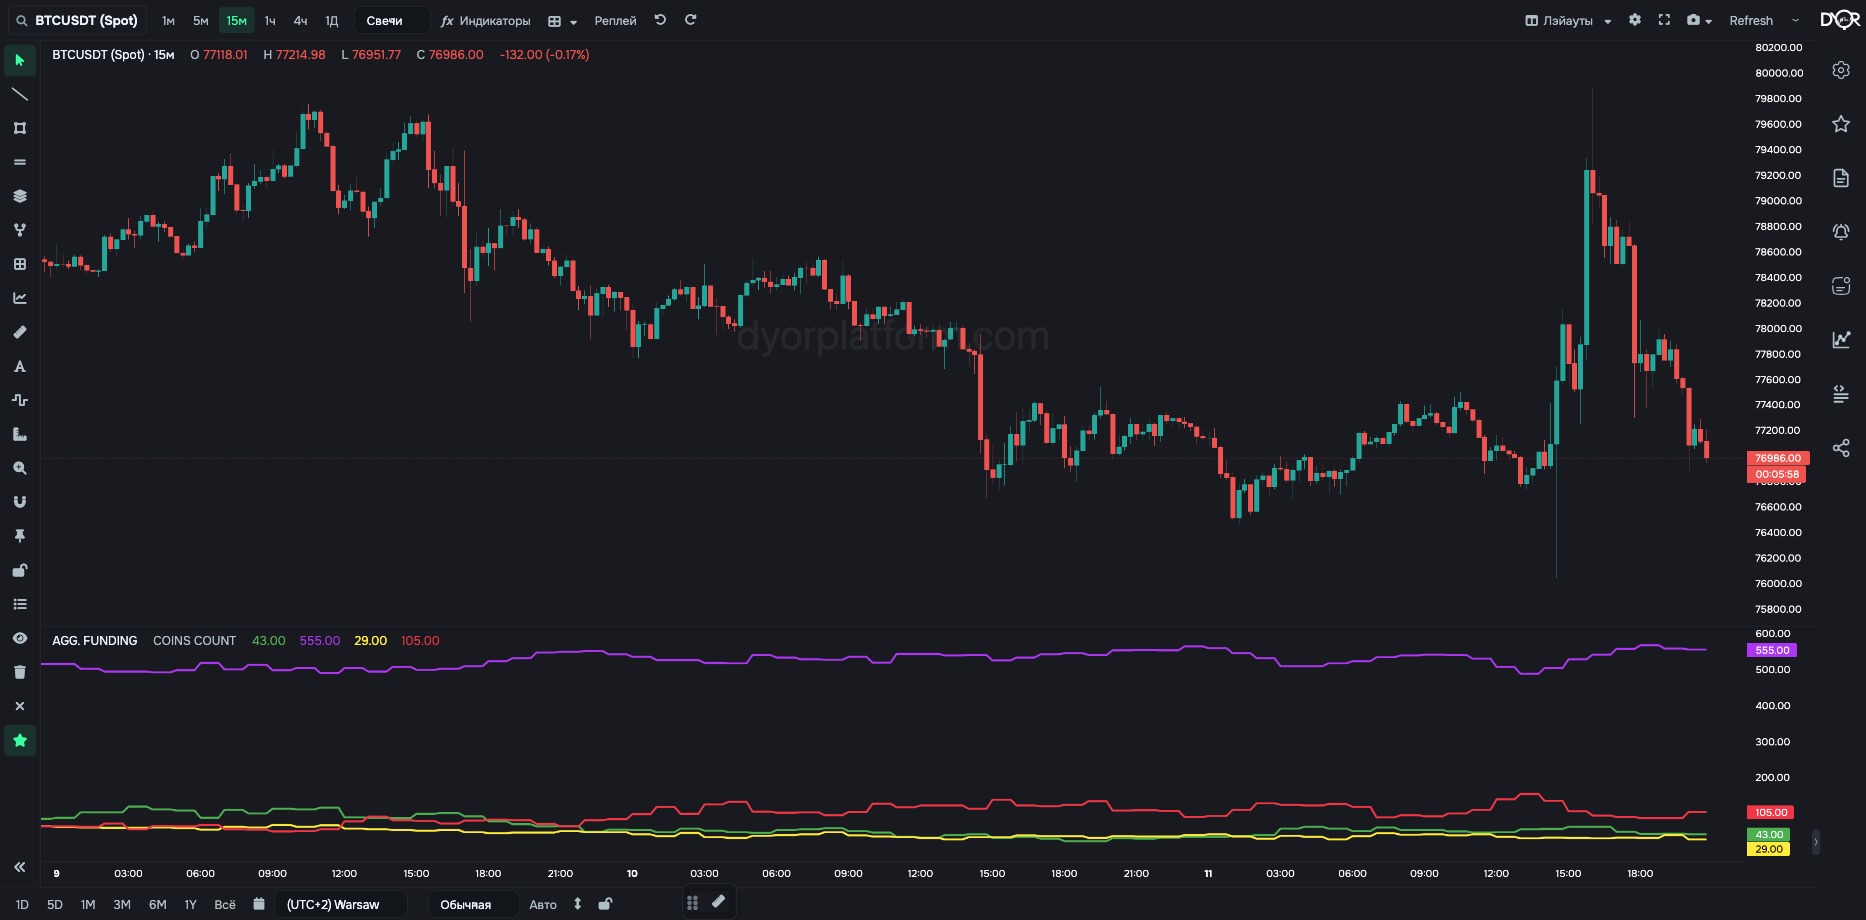
Funding across the whole market. All coins are sorted into four rate categories. Each category gets a line showing how many coins are in it.
The reference point is the Binance base rate: 0.01% per 8 hours. Categories:
All coins with Binance futures are counted, about 740. Units — number of coins or percent of the market.
See who holds the leverage across the whole market at once, not on one coin. Watch not the number but how it moves: the usual level is known, and a deviation from it is an event.
For example.
What happens after overheating. When longs pay more than the base rate across a large part of the market, buyers hold leverage everywhere at once, and their liquidations sit close below the price. One scenario is a cooldown: the market dips, some longs get liquidated, funding returns to normal. By 2020–2026 data, after such hours the dips over the next three days really are deeper than usual: median −2.3% vs −1.5%. But the trend breaks no more often than usual — a week later BTC is still higher at the median, and overheating can last for weeks: in late 2024 the Higher share stayed above 50% for over a month while the price rose. So this is a scenario of elevated dip risk, not a reversal signal. The mirror case for Negative: sellers hold the leverage, and the spikes go up.
| Field | Options | Default | What it changes |
|---|---|---|---|
| Values Type | COINS COUNT PERCENTAGE | COINS COUNT | What to count in: number of coins or share of the market in percent. - Want the absolute number of coins — COINS COUNT. - Want the market share, to compare periods with different coin counts — PERCENTAGE. |
Metric AGG. FUNDING. Condition fields:
“Funding Type” — Higher / Lower / Standard / Negative.
AGG. FUNDING answers one question: who holds the leverage across the whole market at once. All coins with Binance futures are sorted relative to the base rate of 0.01% per 8 hours: Higher — longs pay more than the base, Negative — shorts pay, Lower and Standard — leverage isn't pushing anything. On a typical day three quarters of coins are in Lower. When Higher reaches the hundreds, buyers hold the leverage everywhere: dips over the next few days are deeper than usual, but the trend doesn't break because of it, and overheating can last for weeks. Negative in the hundreds is the mirror case. The indicator assesses the state of the market and its fragility, not direction. The chart coin is not included — it has its own FUNDING RATE.
The Negative line in AGG. FUNDING shows…
Correct answer: How many coins in the market have a negative rate
A coin with a rate of exactly 0.01% falls into the category…
Correct answer: Standard