 Learn hubBlog
Break down ASK BID ANOMALIES: how an anomaly is calculated, what the 24-hour and 7-day norm window means, how much is normal and what the indicator doesn't show.
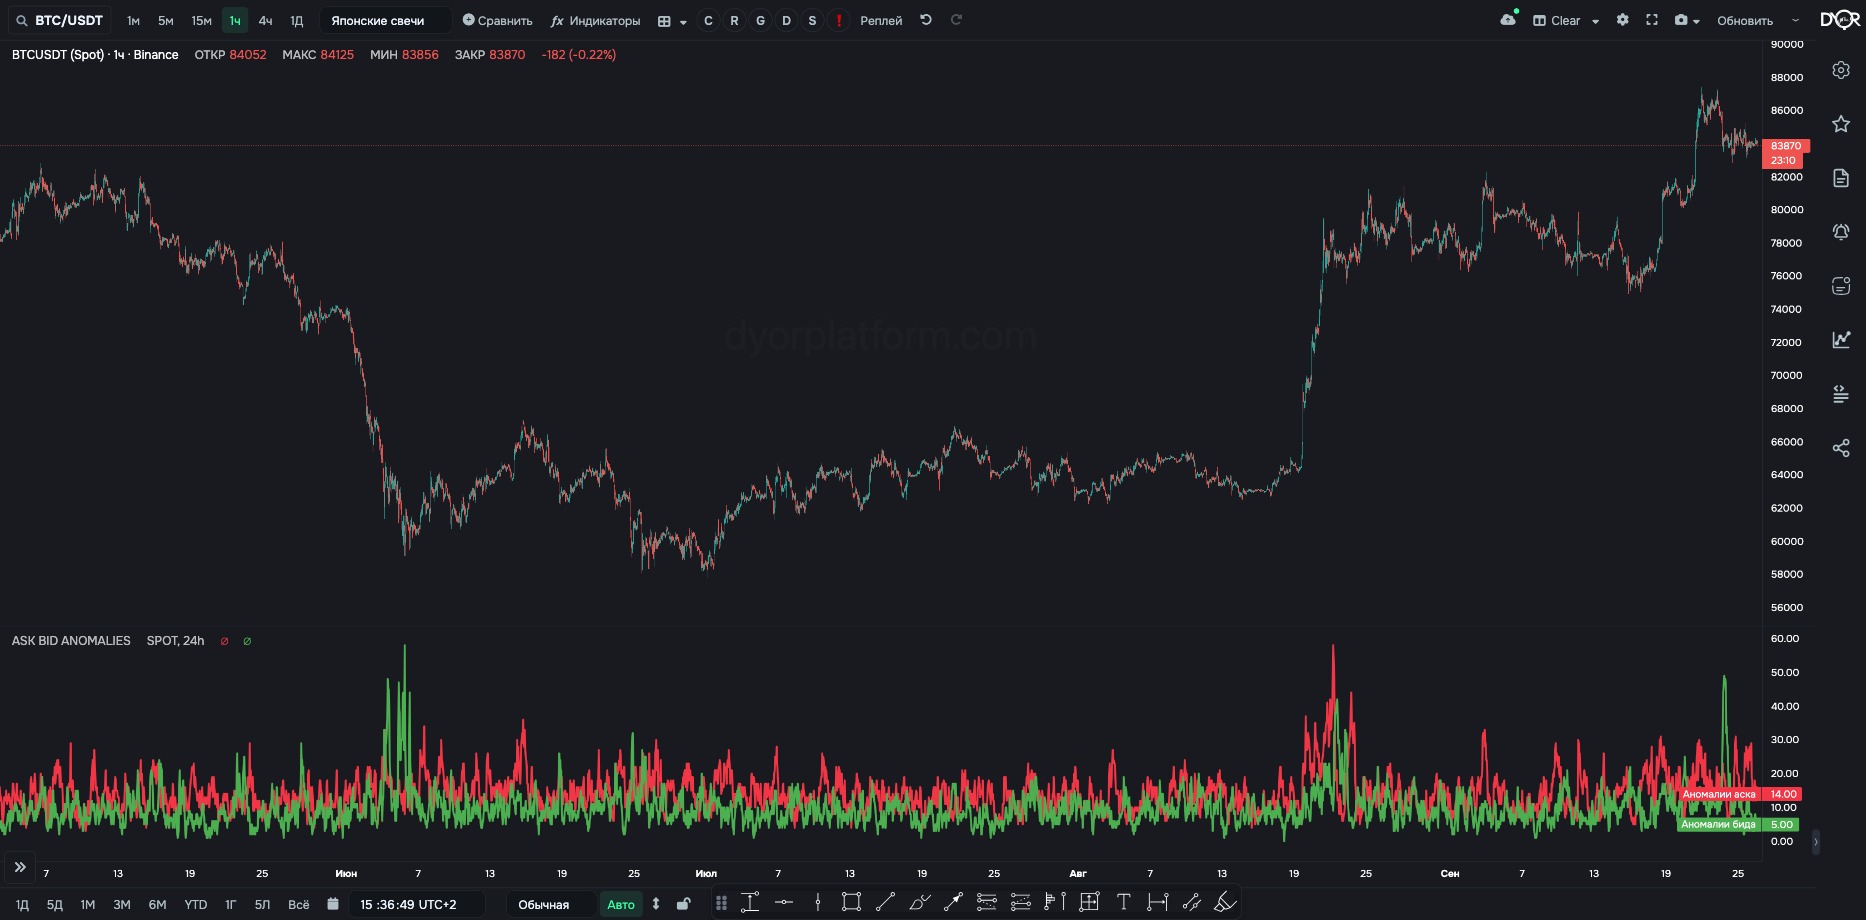
How many coins in the market have an unusual order book skew right now. Two counter lines: asks and bids, in number of coins. Spot and futures are counted separately.
How it's calculated.
How much is normal. Over the last 12 months on 1h: a median of 12 ask coins and 8 bid coins per hour, that's 2–3% of the market. One hour in ten — more than 20 and 15. More than 40 coins — less than one hour in a hundred. There are almost always more ask anomalies: the ratio drops by 1.5 times more often than it rises; that's how the market works.
Spike — not a single hour but a wave of new entries over 2–4 hours. Spikes coincide with big BTC moves in either direction. You can't predict where BTC goes next from the coin count: on 2019–2024 history no counter setting beat the ordinary price path after the same drawdown. What a spike means for a level and how it's read in practice — in the “What it's for” section.
Timeframe. The base calculation is hourly. On 4h and 1d it shows the sum of hourly values. Below 1h the value is taken from the closed bar, but on 1m spoofing gets into the counter: a wall 30% from price is placed and pulled within a minute and means nothing. The working timeframe is 1h and higher.
Norm window: 24 hours or 7 days. A live example, June 5, 2026, 19:00 UTC. With the daily norm: 58 bid coins and 8 ask. With the weekly: 127 bid and 21 ask. Ten hours later the daily counter dropped to 23, the weekly rose to 131. The day shows an event: order books are rebuilding right now. The week shows a state: how many coins still have a skew relative to their week. The weekly counter is higher and lasts longer: a median of 34 ask and 20 bid, episodes above normal stretch up to five days. It follows price rather than leading it: after a weekly drop bid anomalies pile up because asks were pulled relative to the week.
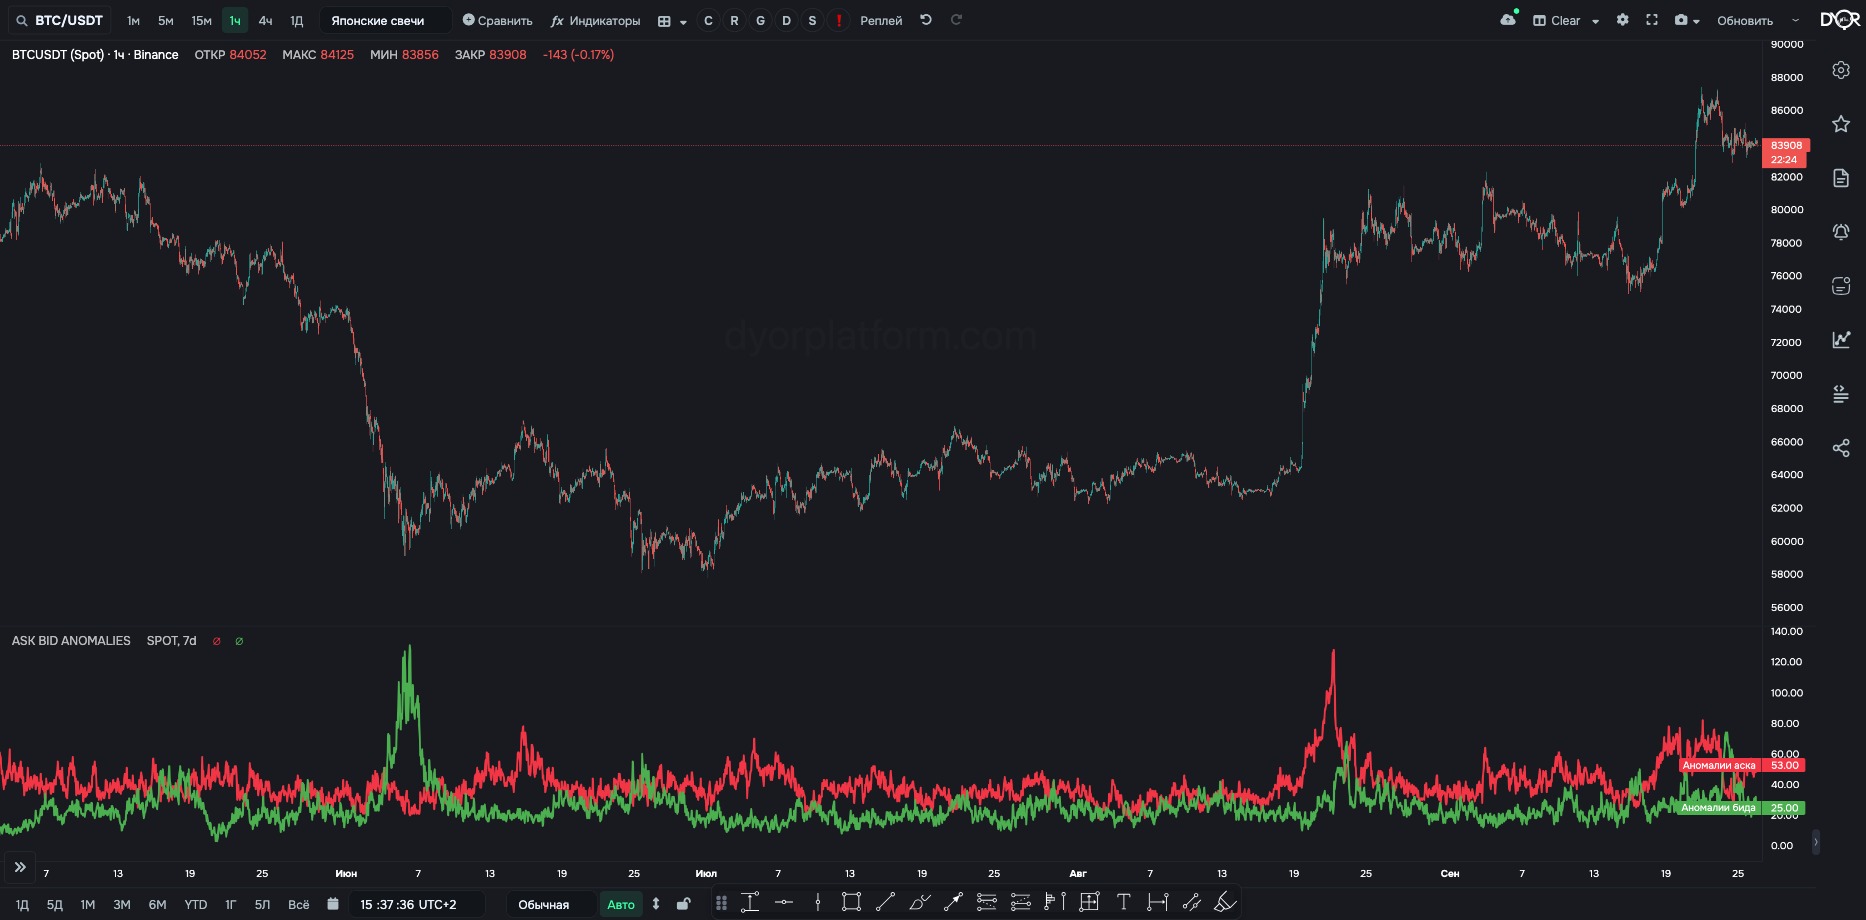
Before September 2026 the indicator calculated the norm differently — over the whole period since the start of the year. The history has been recalculated with the new formula.
Tell an event in a single coin apart from order books rebuilding across the whole market. And get a list of coins whose order book just changed.
For example.
How spikes are read in practice.
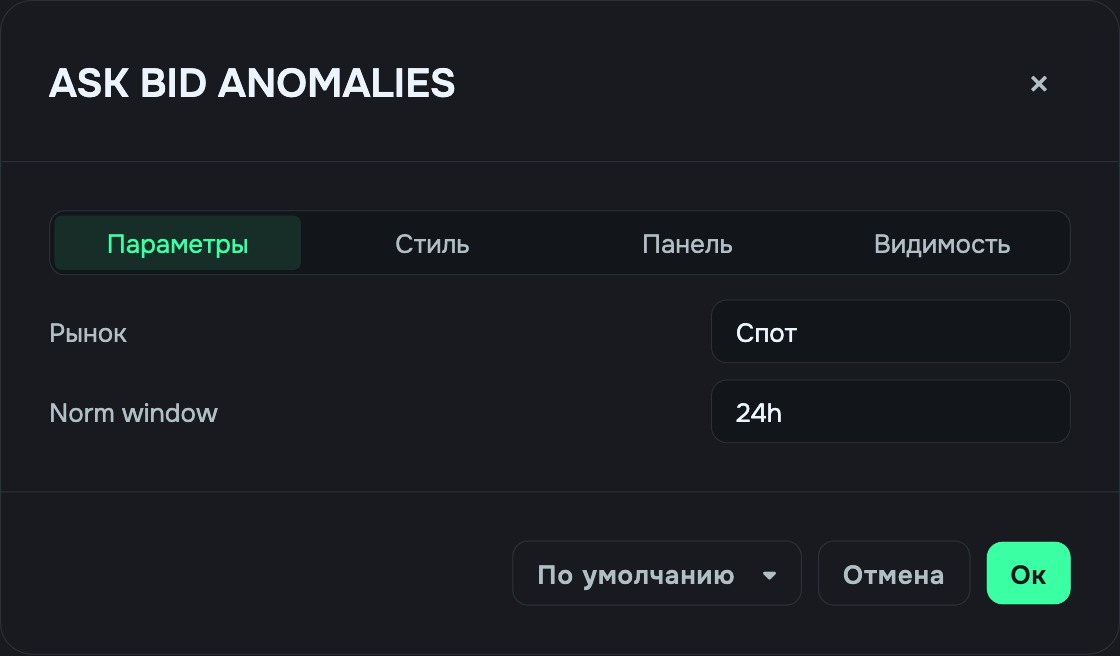
| Field | Options | Default | What it changes |
|---|---|---|---|
| Market Type | SPOT FUTURES | SPOT | Whose order books to count: spot pairs or perpetual futures. Futures coins without spot are only in the second option. |
| Norm window | 24h 7d | 24h | The norm window — what to compare the coin's RATIO against. 24h — an event: the order book rebuilding over the last hours, fades within hours. 7d — a state: skew relative to the week, lasts for days. Thresholds differ by window: the weekly median is three times higher. In alerts this field is also called “Norm window”. |
Metric ASK BID ANOMALIES. Condition fields:
The metric is market-wide — no coin is selected. Set the threshold for your window.
ASK BID ANOMALIES counts coins whose RATIO within ±30% deviated from their own norm by 1.5 times: above — a bid anomaly, below — an ask anomaly. A daily norm catches an event, a weekly one — a state. Usually 2–3% of coins per hour; more than 40 is rare. The more coins in a spike, the more anomalous it is and the more weight the level carries. In practice a bid-anomaly spike is a level that's harder to push through, a zone to build spot in parts, especially in a rising market; an ask-anomaly spike is local pressure, a place for partial profit-taking. Not a guarantee: the level can break, watch the price reaction and COIN TRADES. Use 1h and higher.
Bid anomalies = 45 on the daily window. What does it mean?
Correct answer: Within an hour the 30% RATIO rose 1.5 times relative to the day in 45 coins at once — order books are rebuilding across the whole market
A coin's daily RATIO norm is 1.2. At what RATIO will the platform record a bid anomaly?
Correct answer: From 1.8 and up: norm × 1.5