 Learn hubBlog
Break down TOTAL AVG — the average RATIO across the market's coins: skew by coins, not by money, and how it differs from TOTAL RATIO.
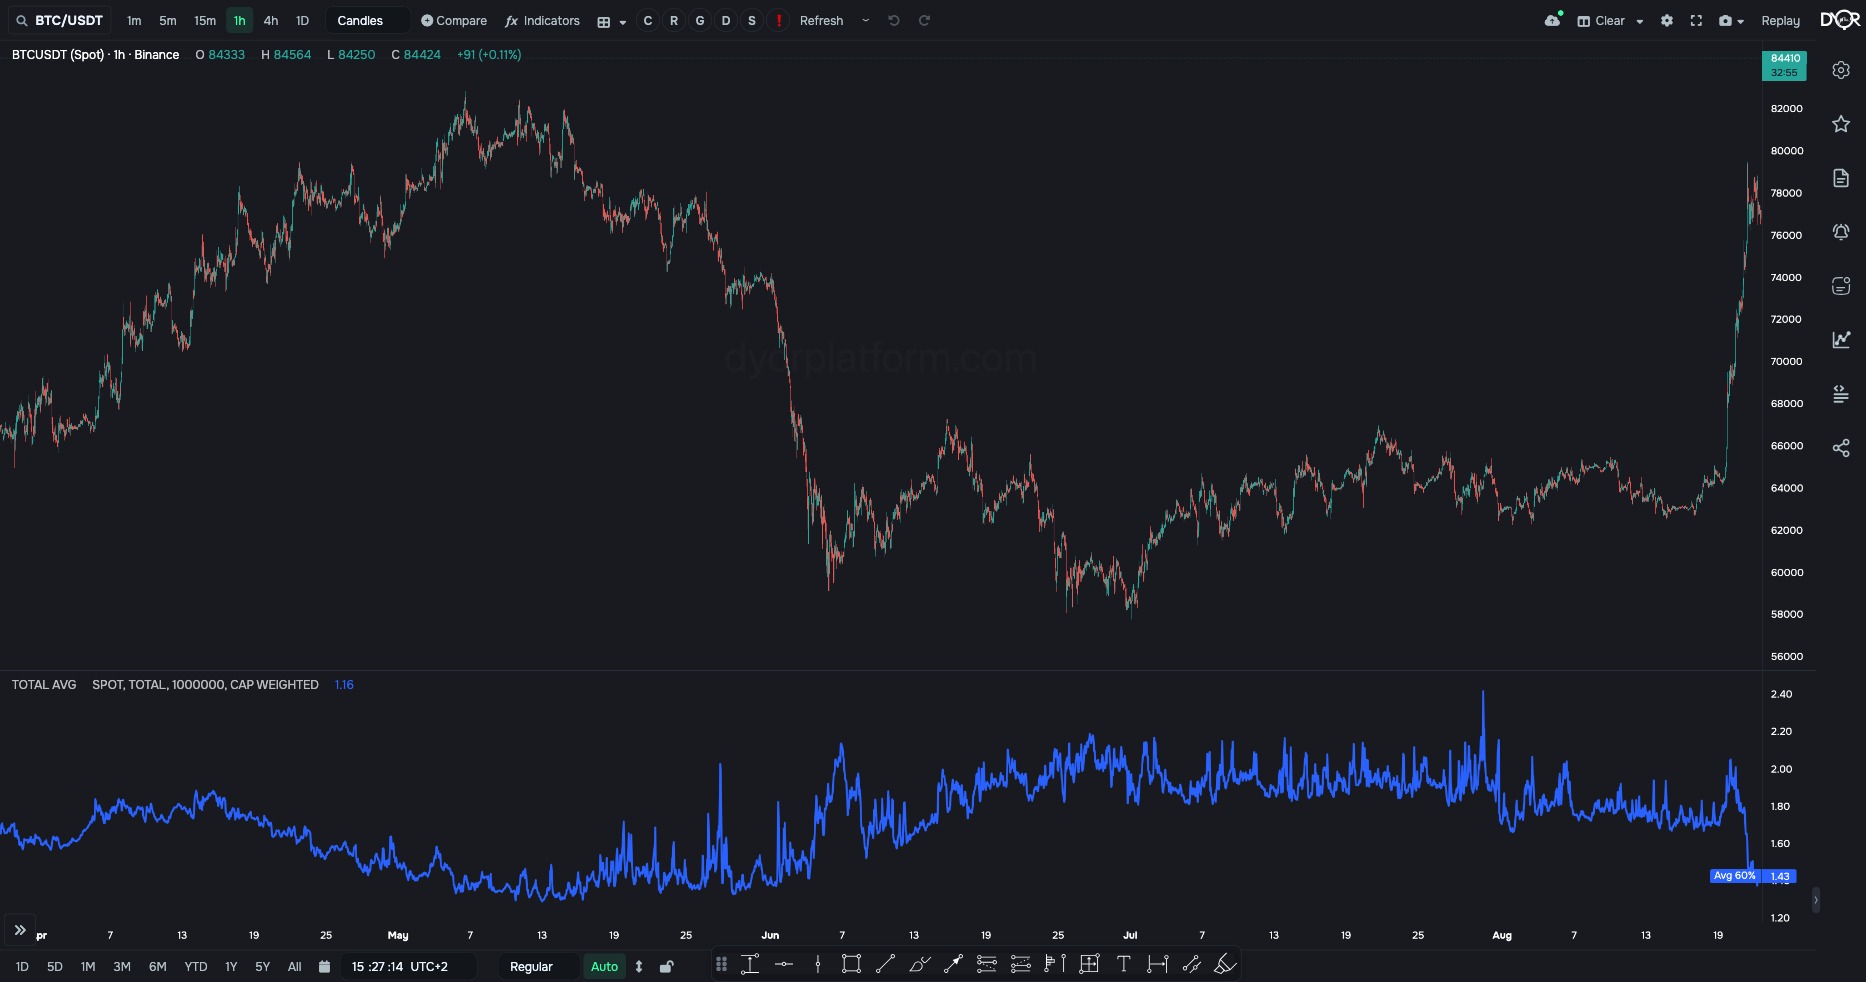
The average RATIO of the market's coins. The indicator averages ratios; it doesn't add up money.
How it's calculated:
How to average is chosen by the “Averaging” parameter:
Why two modes. BASIC has a weak spot. An illiquid coin has a thin order book: there are almost no asks, and its RATIO shoots up to 10–12. In a “one coin, one vote” average such a coin pulls the whole line up — the chart shows a spike with nothing behind it but one coin's empty order book. CAP WEIGHTED fixes this: a small coin's market-cap weight is negligible, so its spike barely gets into the average. The line is smoother and shows the order books of coins where real money sits.
Bitcoin dominates. BTC is more than half of the market’s capitalisation, so in CAP WEIGHTED its RATIO sets most of the line: BTC at 1.2 with alts at 0.7 gives about 1.0. To separate Bitcoin from the market, put a second TOTAL AVG with Total Type TOTAL3 next to it: it counts the same thing without BTC and ETH. The lines diverge — demand only in the large coins or only in the alts. They move together — across the whole market. A second way is BASIC next to CAP WEIGHTED: a divergence shows that large and small coins behave differently.
How it differs from TOTAL RATIO. TOTAL RATIO adds up money: all bids in the market ÷ all asks in the market. A coin's weight is the size of its order book. CAP WEIGHTED is also skewed toward large coins, but the weight is market cap, not money in the book, and it adds up ratios, not dollars. A coin with a large market cap and a thin order book weighs a lot in CAP WEIGHTED and almost nothing in TOTAL RATIO.
The screenshot shows BTC/USDT 1h, April–August, CAP WEIGHTED, 60% depth. End of May: price at its highs, TOTAL AVG at its low of 1.3–1.4 — large coins have only a third more bids than asks, demand in the order books has run out. June–July: price at its lows, the line rose to 2.0–2.2, with a spike to 2.4 at the end of July — twice as many bids as asks, large coins' order books skewed toward demand.
See the order book skew of the whole market by coins, not by money.
TOTAL RATIO adds up all bids in the market and divides by all asks. That's the skew of money, and it's set by BTC and ETH. TOTAL AVG takes each coin's RATIO and averages them. That's the skew of the whole coin list: what the order books of most coins look like, regardless of their size.
For example.
| Field | Options | Default | What it changes |
|---|---|---|---|
| Market | SPOT Futures | SPOT | Whose order book to count: the spot or the futures market. SPOT or FUTURES in the pane legend. - Want orders from people buying the coin itself — SPOT. - Want orders from people trading with leverage — FUTURES. On Coinbase, Hyperliquid and Deribit the switch does nothing: Coinbase is spot only, Hyperliquid and Deribit are futures only, the value is set by the exchange itself. |
| Total type | TOTAL TOTAL2 TOTAL3 TOTAL_TOP_100 TOTAL_BOTTOM_100 OTHERS TOTAL (-STABLE) | TOTAL | Which coins go into the sum. The values are covered on the “Coin and Market” screen. - Want the whole market — TOTAL. - Want altcoins without bitcoin — TOTAL2, without BTC and ETH — TOTAL3. - Want only large coins — TOTAL_TOP_100, only small ones — TOTAL_BOTTOM_100, without the top ten — OTHERS. - Want to drop stablecoin pairs — TOTAL (-STABLE). |
| Max Value | 0 … 1,000,000 | 1,000,000 | Outlier filter. If the average is above the threshold, the point isn't drawn — the line has a gap. It's a crude filter for the same problem CAP WEIGHTED solves: it cuts out the whole point instead of removing the cause. Lower the threshold if single coins with an almost empty order book cause outliers and squash the scale. |
| Averaging | BASIC CAP WEIGHTED | BASIC | How to average. BASIC — each coin with one vote. CAP WEIGHTED — a coin's weight by its market cap. Why CAP WEIGHTED: in BASIC one illiquid coin with RATIO 10–12 (almost no asks) pulls the average up — the line shows a spike for no reason. With market-cap weighting such a coin barely counts. CAP WEIGHTED on Binance exists from March 2019 on 15m, 1h, 4h and 1D. 16–17 Hyperliquid tokens have no supply data: they drop out of CAP WEIGHTED and of TOP_100, BOTTOM_100, OTHERS. Where delisted coins took away more than half of the order book, the bar is empty. - Want to see all coins' order books equally, small ones included, at the risk of single outliers — BASIC. - Want a line without outliers from illiquid coins, where large coins decide — CAP WEIGHTED. - Want to see the market without Bitcoin — a second TOTAL AVG with Total Type TOTAL3. |
By default the 3% depth is shown. The recommended 30% and 60% are turned on in the Style tab with the checkboxes next to the lines. The color of each line is set there too.
Metric TOTAL AVG. Condition fields:
“Total type” — TOTAL, TOTAL2, TOTAL3, TOP 100, BOTTOM 100, OTHERS, TOTAL (-STABLE). Old alerts without this field keep counting by TOTAL. “Market type” here is SPOT or FUTURES. “Averaging” — BASIC or CAP WEIGHTED, as on the chart.
TOTAL AVG = the average RATIO of the market’s coins at a depth: it averages ratios, not sums money. BASIC — one vote per coin, 1.3 — a typical coin has 30% more bids. CAP WEIGHTED — weight by capitalisation: removes the outliers of illiquid coins, but Bitcoin pulls it over — put a TOTAL AVG with Total Type TOTAL3 next to it. Watch on 1h and up, depths 30–60%.
TOTAL AVG = 1.3 means…
Correct answer: In BASIC — the typical coin in the market has 30% more bids; in CAP WEIGHTED — the large ones do