 Learn hubBlog
COIN S. TRADES.
The indicator tracks spot market trades and shows as a delta (bars) which side had more over the selected timeframe, and by how much.
To open the indicator:
- go to the [DYOR] Indicators menu at the top of Multichart.
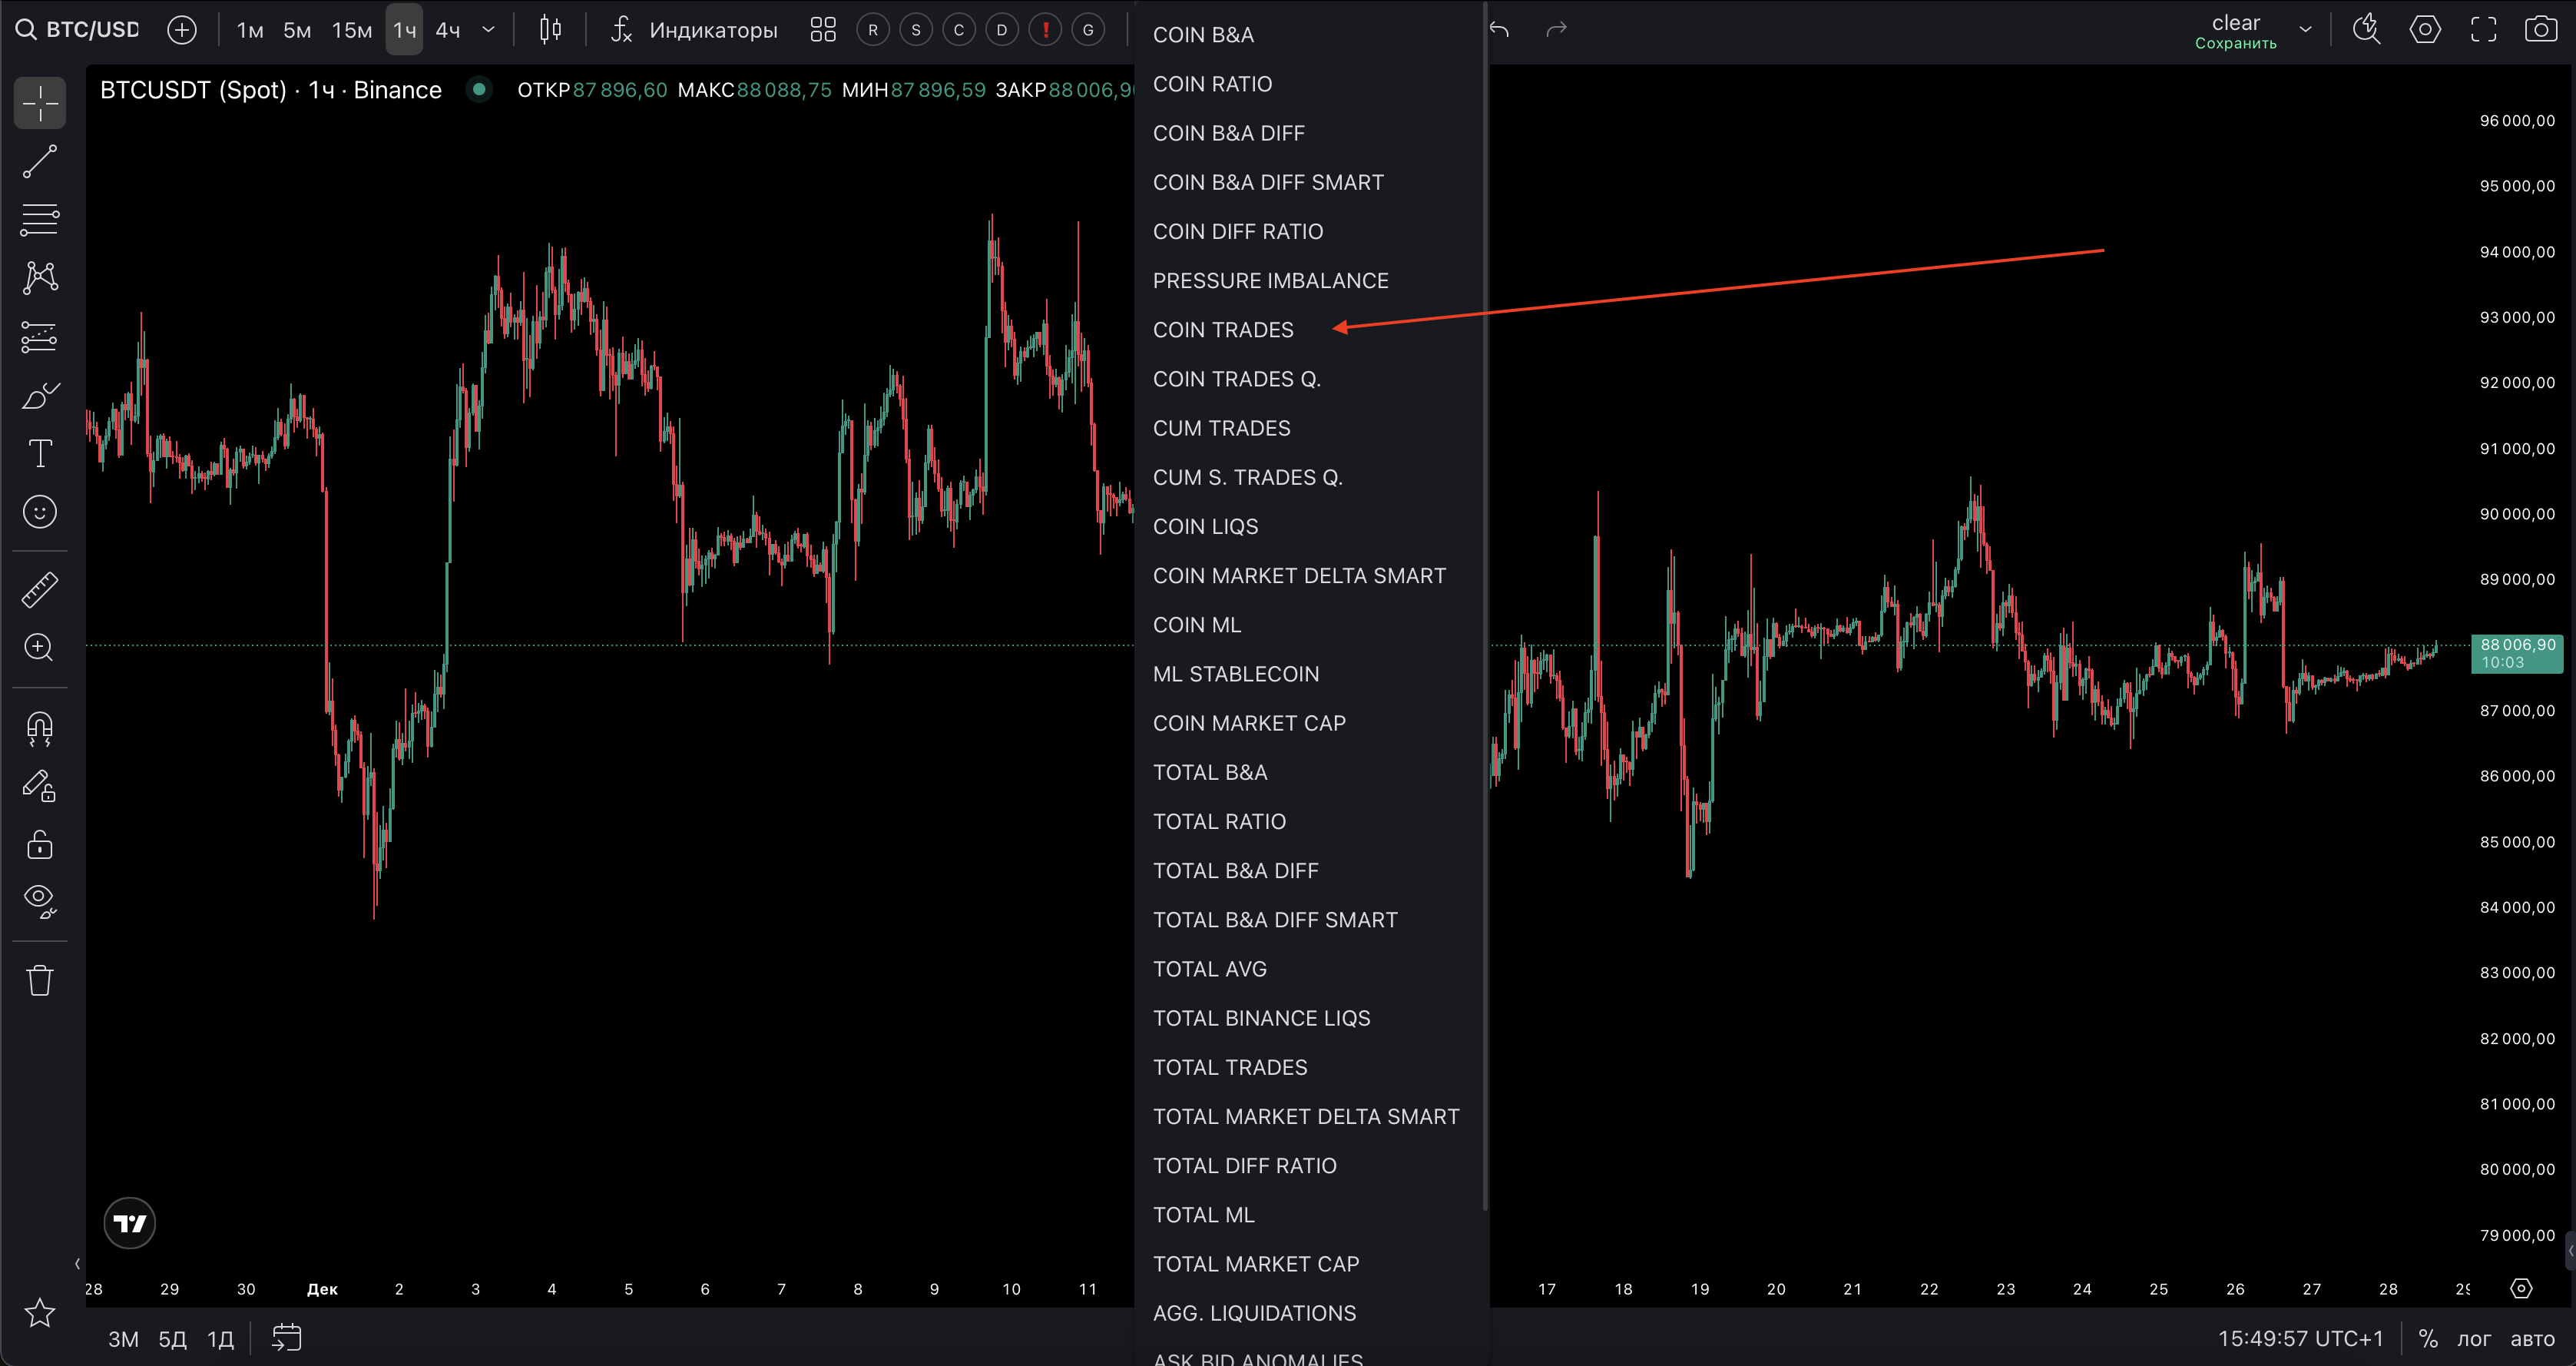
- select the indicator COIN TRADES.
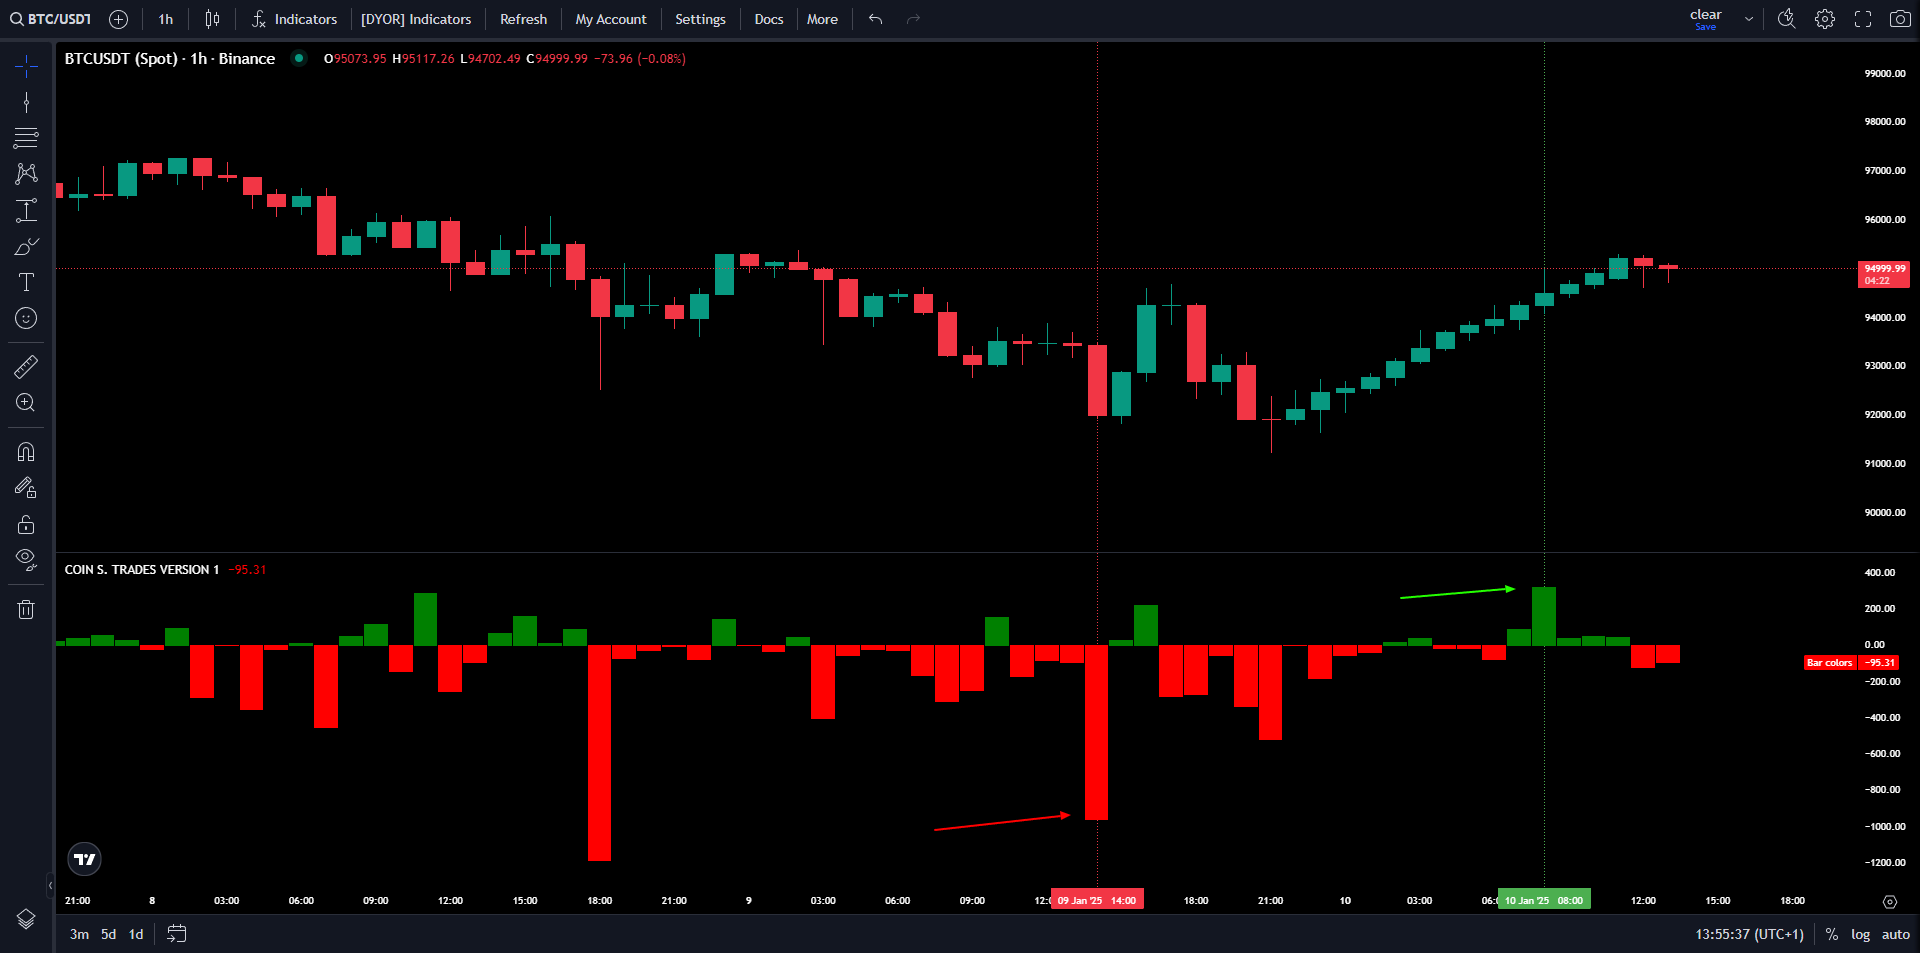
To see exactly how much more buying or selling there was, hover your cursor over a bar and the value will be shown on the left side of the indicator next to the ⚙(gear icon), or check it against the right vertical scale of values.
For example:
in the screenshot below we can see that over one hour the market sold 1000 +BTC more than was bought, which is why the bar is colored red and points down (highlighted with a red dashed line).
In the second case (highlighted with a green dashed line) the bar is colored green and points up, which means that during this hour the market had more market buys by 400 BTC.
COIN F. TRADES.
The indicator tracks futures market trades and shows as a delta(bars) which side there was more of during the selected timeframe, and by how much.
The only difference between COIN S. TRADES. and COIN F. TRADES. is that the first indicator tracks trades on the spot market, while the second indicator takes them from the futures market.
Market sentiment analysis:
The indicator shows who dominates the market: market buyers or sellers.
For example, if the market delta is positive (bar pointing up), buyers dominate by market order volume
If the delta is negative (bar pointing down), sellers dominate by market order volume
Assessing the intensity of a move:
The size of the delta helps assess how much pressure one of the sides is applying. The bigger the delta, the stronger that side.
A trend of growing/shrinking bar size can point to the continuation or the end of one side's dominance
Comparing the spot and futures markets:
COIN S. TRADES reflects real buying/selling of the asset.
COIN F. TRADES shows what is happening in the derivatives market. This matters because futures often influence the spot price movement.
Trend confirmation:
If both indicators (spot and futures) show a matching direction (for example, both deltas are positive), this increases the probability of trend continuation.
Spotting manipulation:
If the delta is positive in the spot market but sharply negative in the futures market, this may indicate attempts to manipulate the price (for example, artificial pressure on the spot price).
Entering and exiting a position:
Significant delta spikes can be a signal to open/close a position. For example, a sudden dominance of market buys can be a signal to enter a long, and its fading a signal to consider closing the position.
What does the COIN S. TRADES indicator show?
Correct answer: The delta of market trades on the spot market over the selected timeframe.
How can you use the COIN S. TRADES and COIN F. TRADES indicators to confirm a trend?
Correct answer: Look for the delta direction to match on both markets together with the price moving in the same direction..
🎉 Congratulations! 🎉
You have successfully completed the lesson on COIN S. TRADES and COIN F. TRADES!