 Learn hubBlog
CUM COIN S. TRADES.
An indicator that calculates the cumulative market delta (accumulated values) over the period you select, based on spot market trades.
To open the indicator:
- go to the [DYOR] Indicators menu at the top of Multichart.
- select the CUM COIN S. TRADES indicator
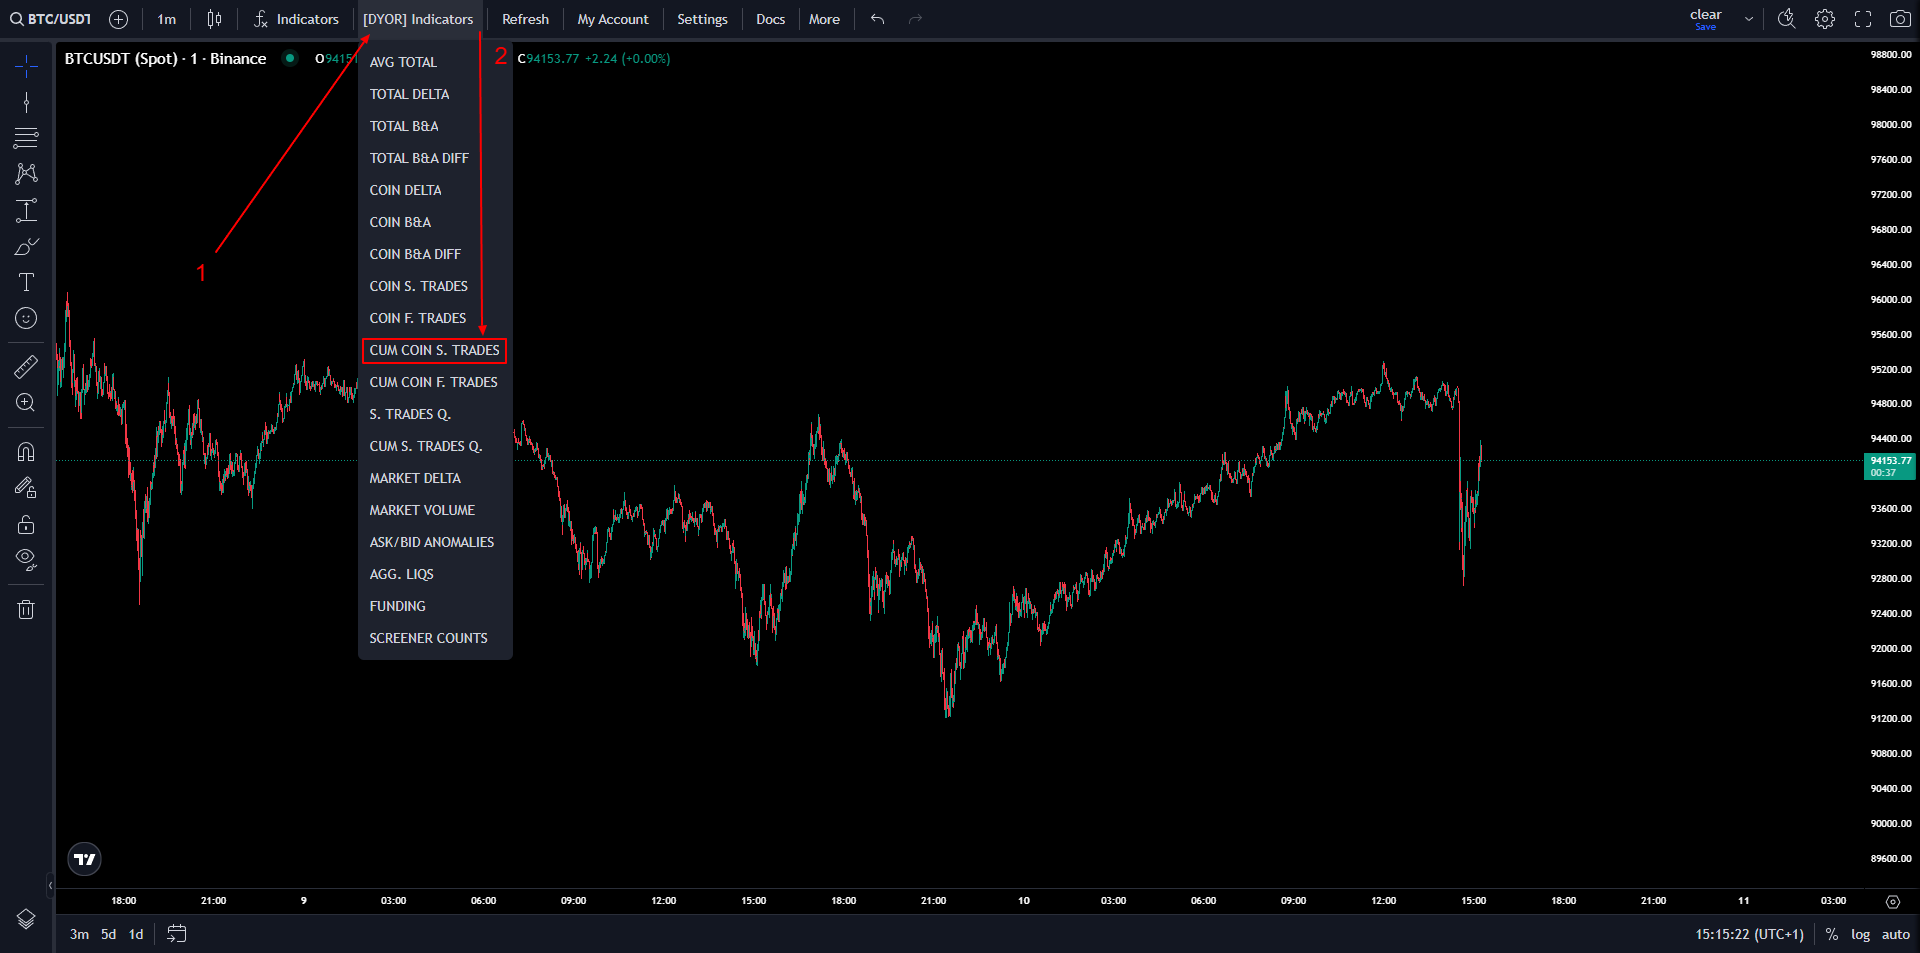
Indicator activation option #1:
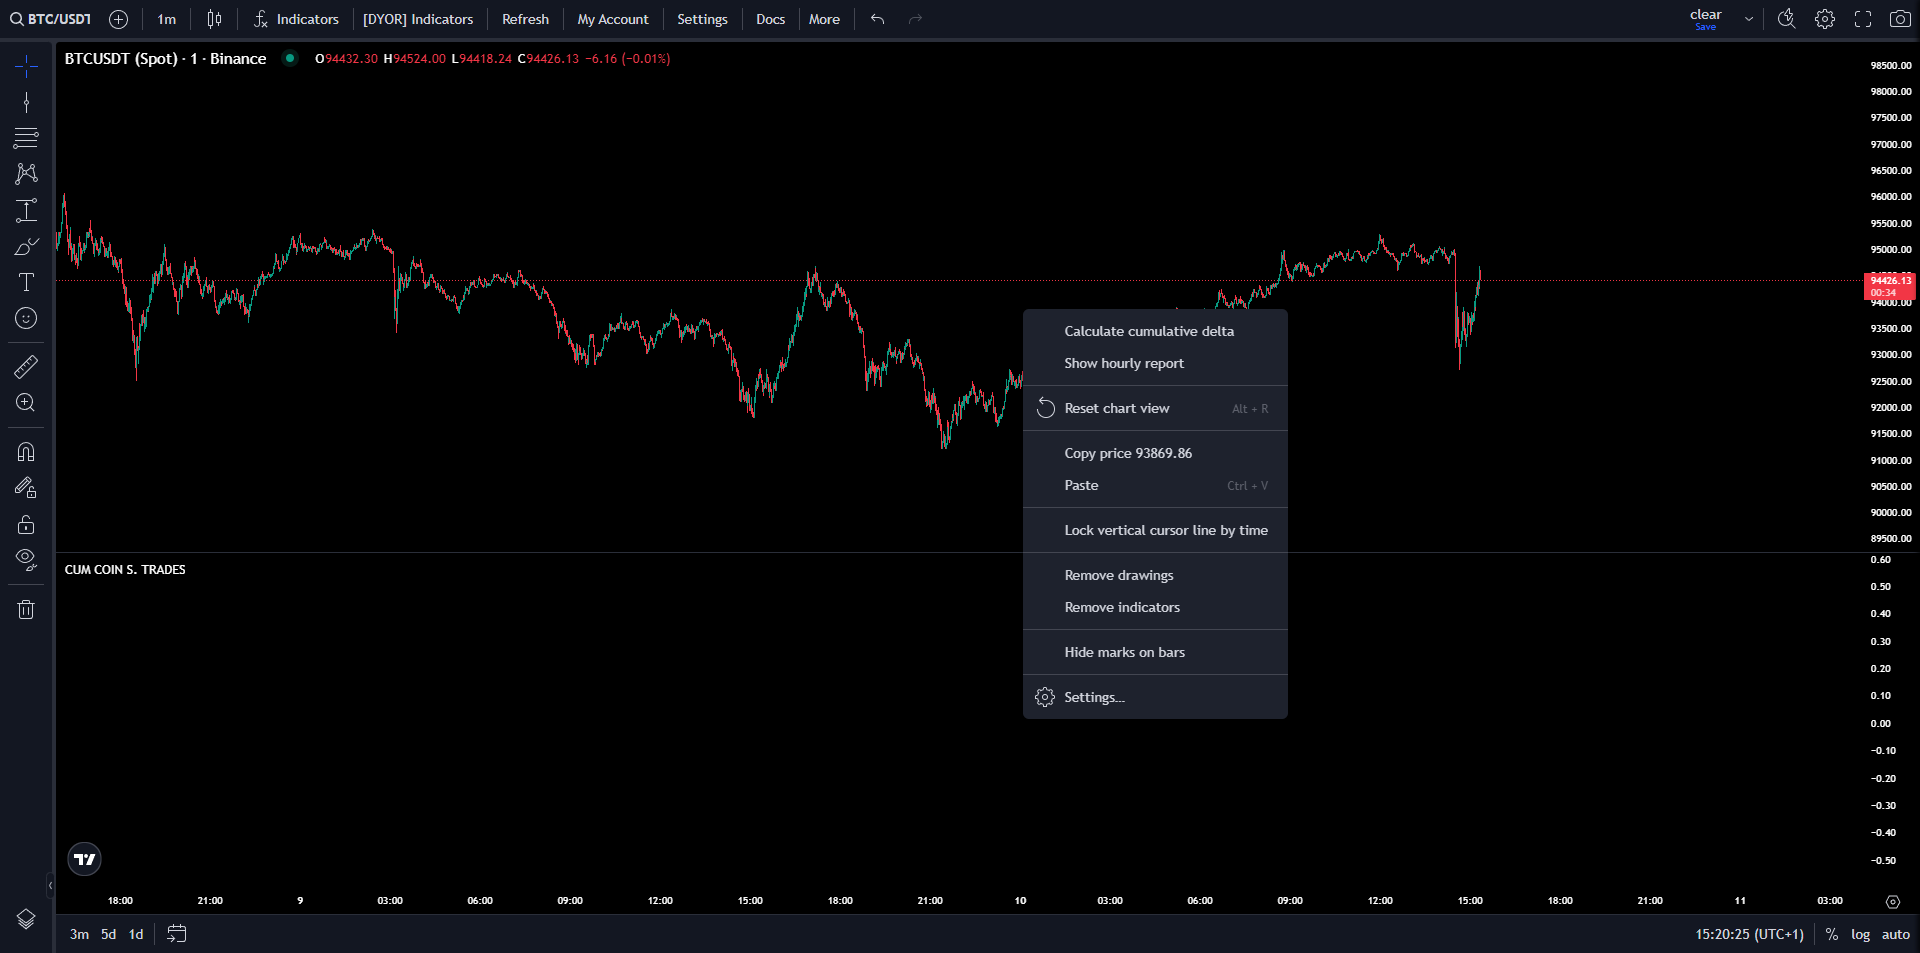
hover the cursor over the chart at any spot you are interested in
click the right mouse button
in the pop-up menu click - calculate cumulative delta
*the cumulative delta will be calculated from the specified time to the current time
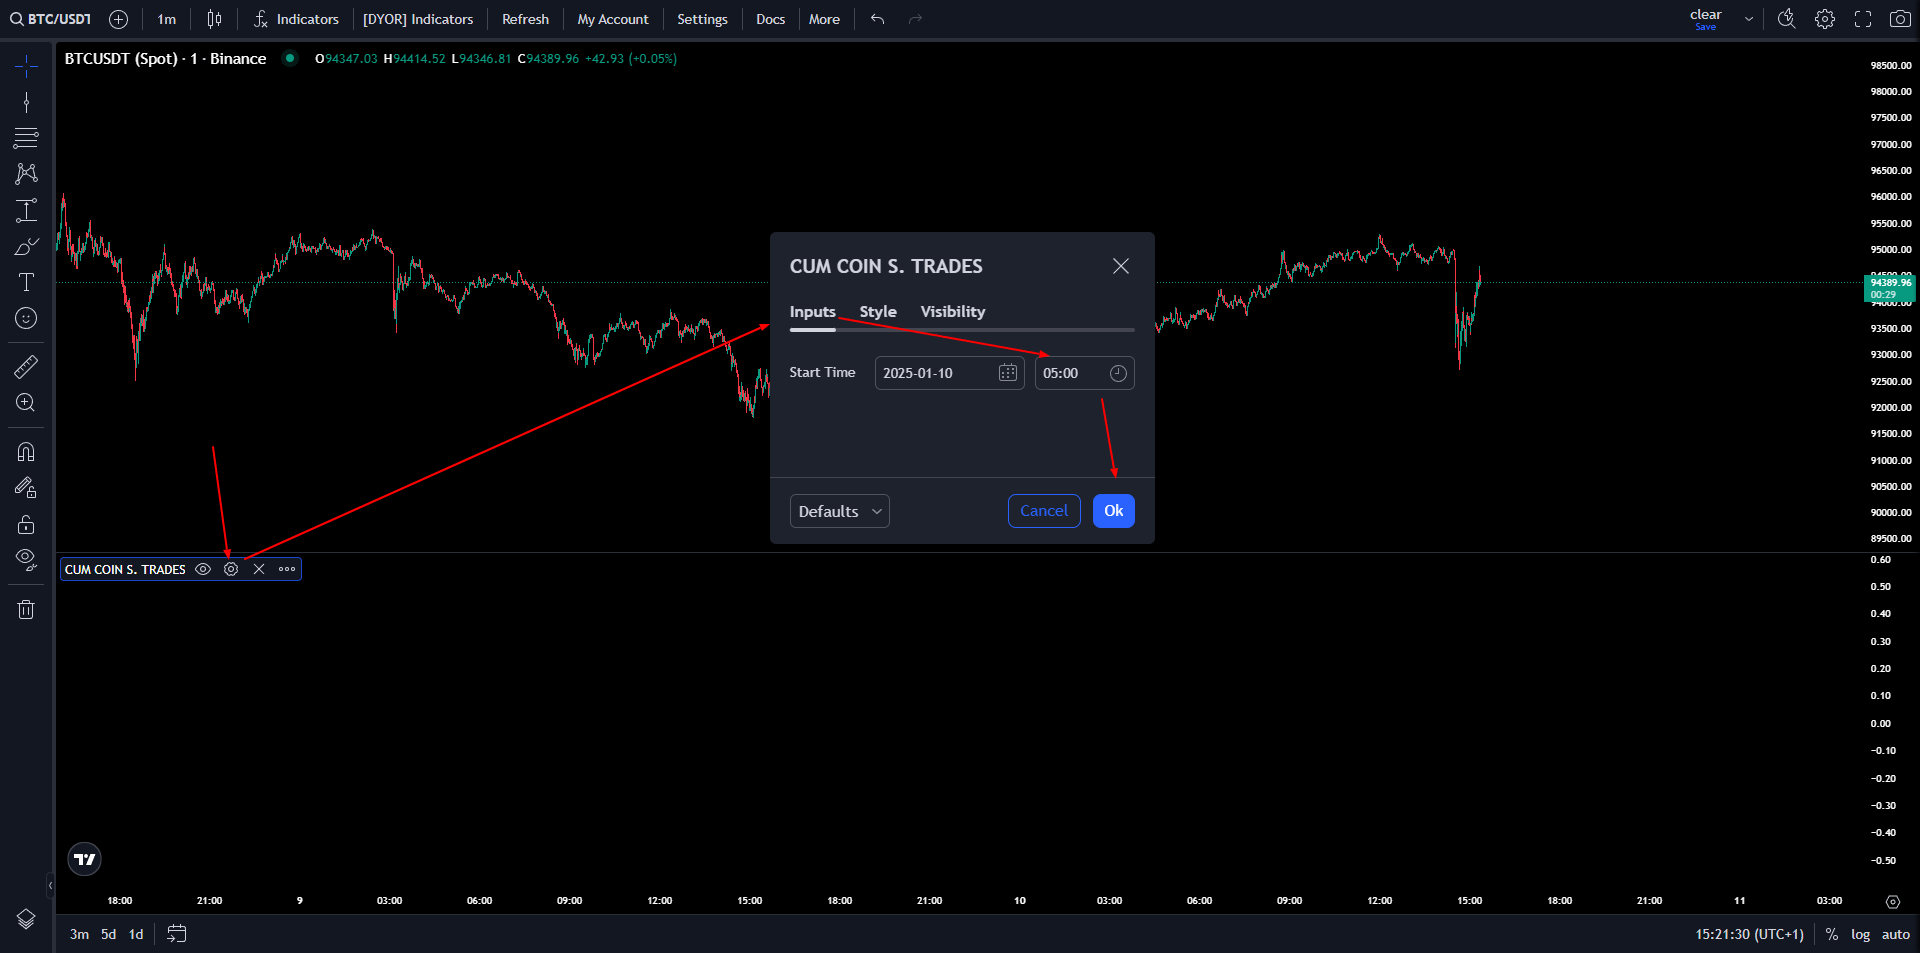
Indicator activation option #2:
next to the indicator's name in the panel of added indicators, click the gear icon
click inputs
enter the start time and date for the cumulative market delta calculation, click ok
*the cumulative delta will be calculated from the specified time to the current time
You need this indicator to track market order tendencies on the spot market.
If we see the cumulative delta increasing - it means the market buyer continues to dominate on the spot market, and if at some point the cumulative delta decreases - it means the seller is starting to show activity.
Example:
In this screenshot we can see the cumulative delta falling, which means that market sells have dominated since its calculation started.
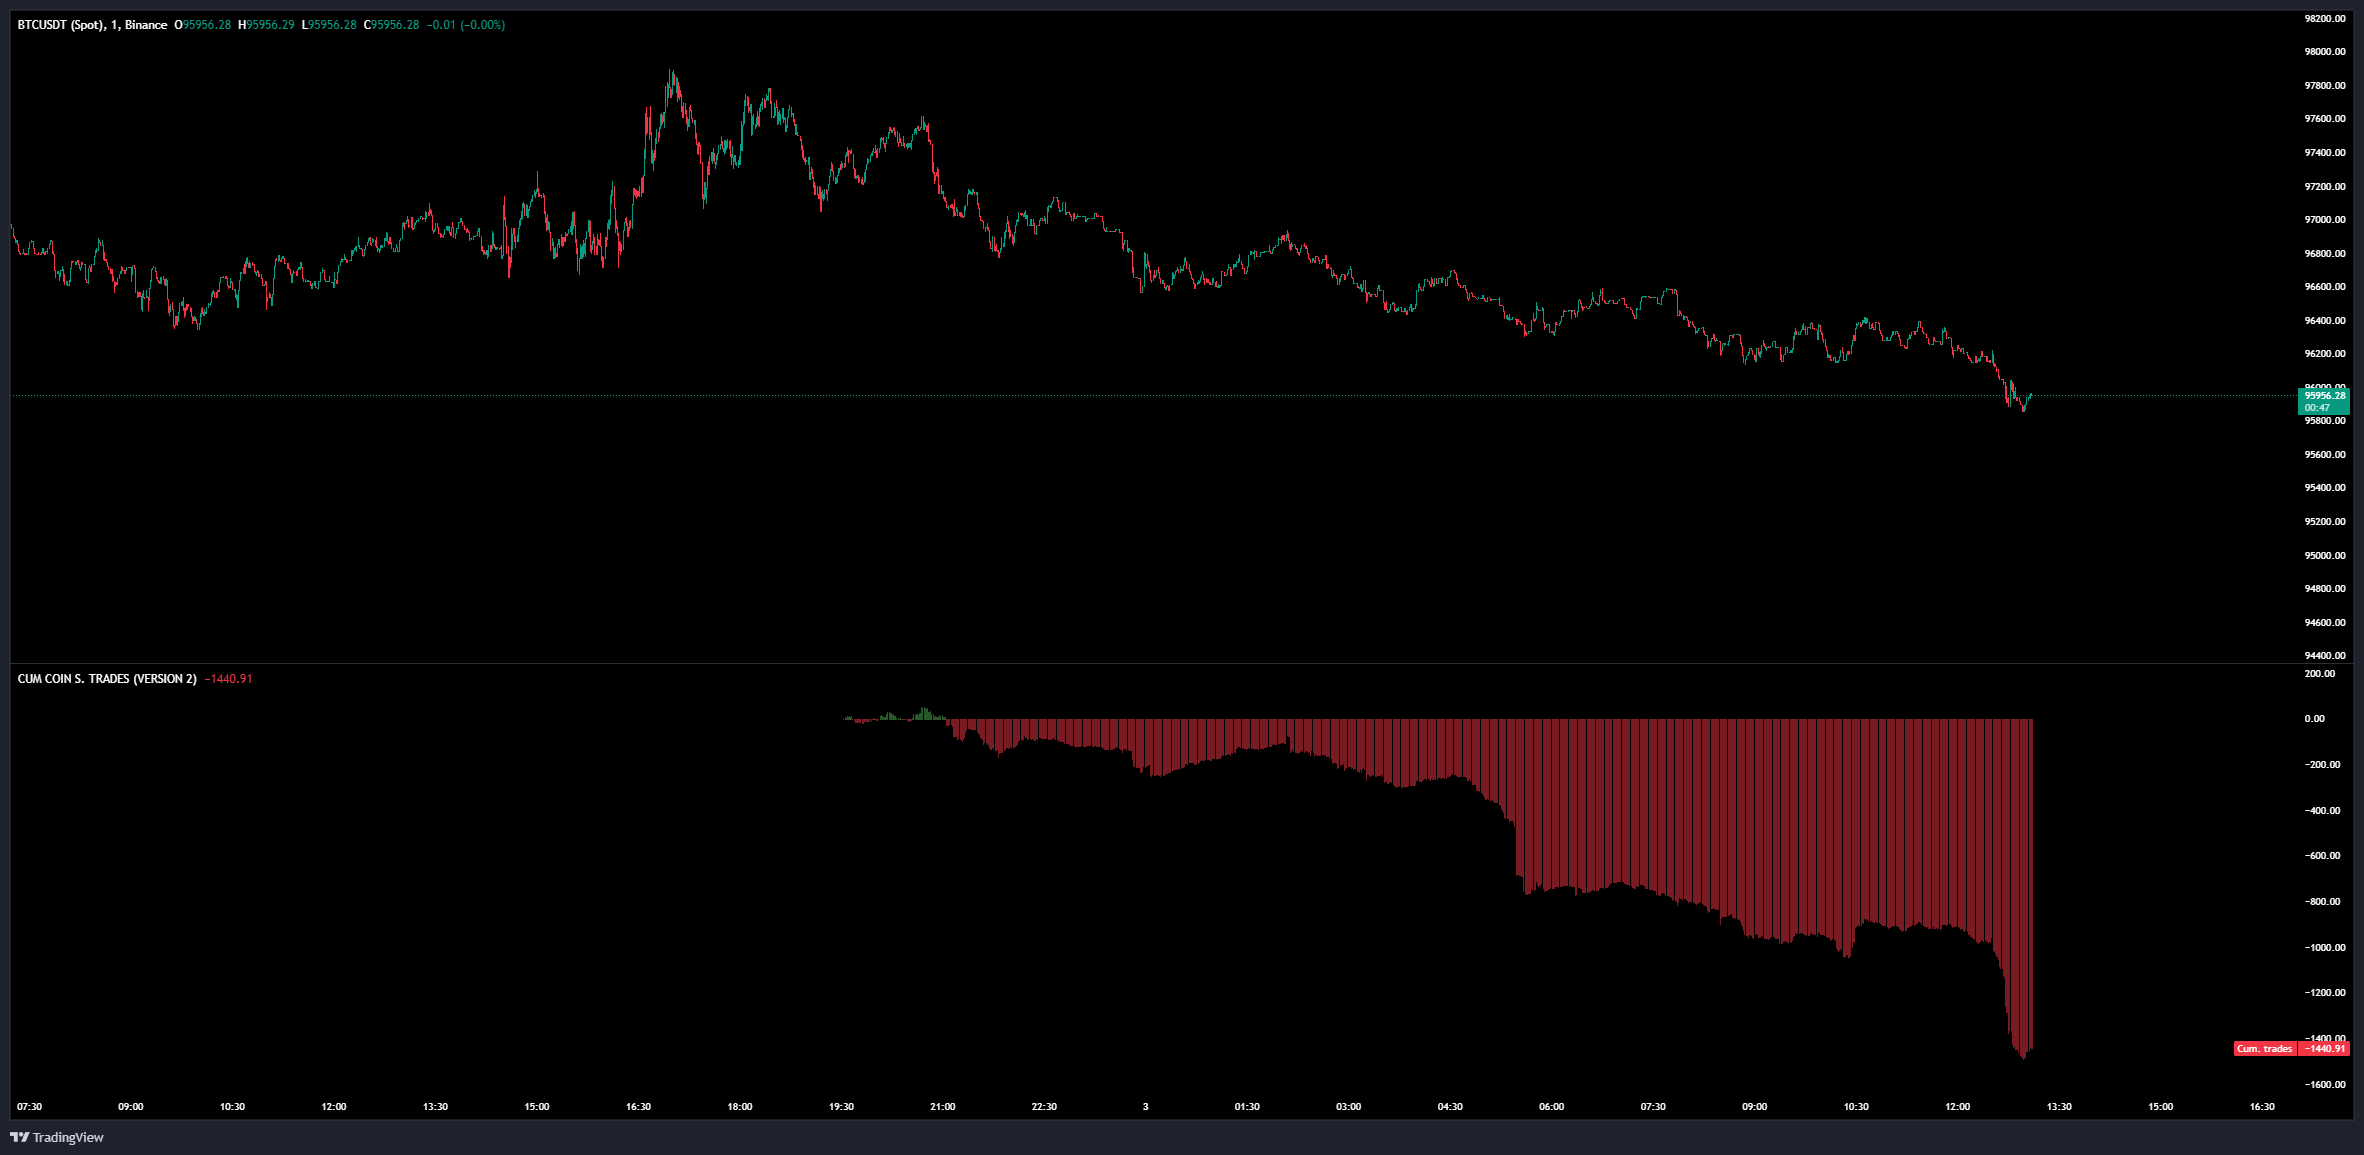
We can draw a conclusion about further price movement by comparing the change in the cumulative delta with the asset price's reaction to that change.
The delta is falling and the price is dropping? - There is not enough limit demand to absorb the sell volume, and going forward a continuation of the short move is more likely.
CUM COIN F. TRADES
An indicator that calculates the cumulative market delta (accumulating values) over the period you select, based on futures market trades.
This indicator is activated the same way as the previous indicator in this lesson.
Remember that for the most accurate conclusion about the current situation you should combine several indicators.
What is the main function of the CUM COIN S. TRADES and CUM COIN F. TRADES indicators?
Correct answer: Cumulative indicators analyze precisely market trades and their accumulated values over the specified time interval.
What can point to limit pressure when using CUM COIN S. TRADES?
Correct answer: The delta grows, but the price stays in place.
How do the CUM COIN S. TRADES and CUM COIN F. TRADES indicators differ?
Correct answer: The type of market analyzed: spot or futures.
In the spot market you see that the CUM COIN S. TRADES delta is actively growing while the asset's price stays unchanged. After 10 minutes the cumulative delta starts to fall sharply. Which answer is most likely, and what would you do?
Correct answer: The price will most likely go down if the market seller steps in.
🎉 Congratulations! 🎉
You have successfully completed the lesson on CUM COIN S. TRADES and CUM COIN F. TRADES!