 Learn hubBlog
Take apart the “Divergences” tab: what the platform counts as a divergence, how it draws it on the chart, what to configure and how to put it in an alert.
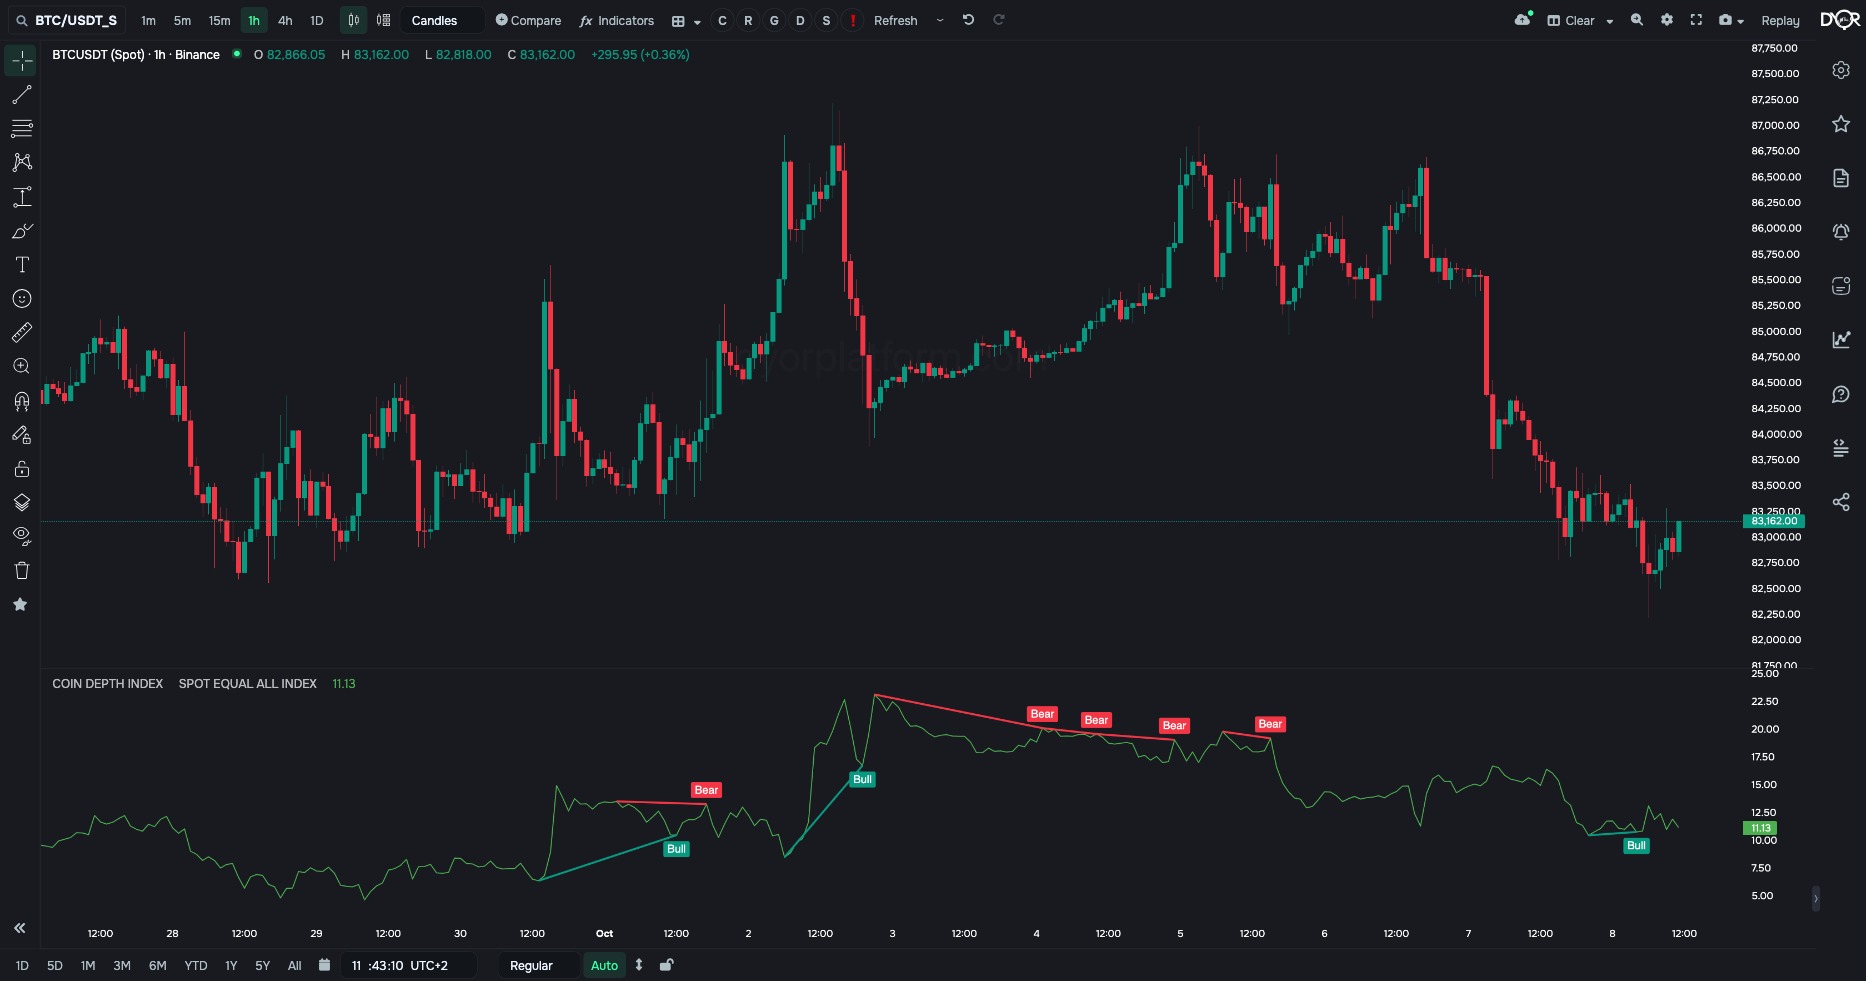
A divergence is a split between the price and an indicator line. The price made a new low, the indicator did not. Or the price made a new high, the indicator did not. The platform finds such spots itself and draws them on the chart. Every indicator with lines has a “Divergences” tab.
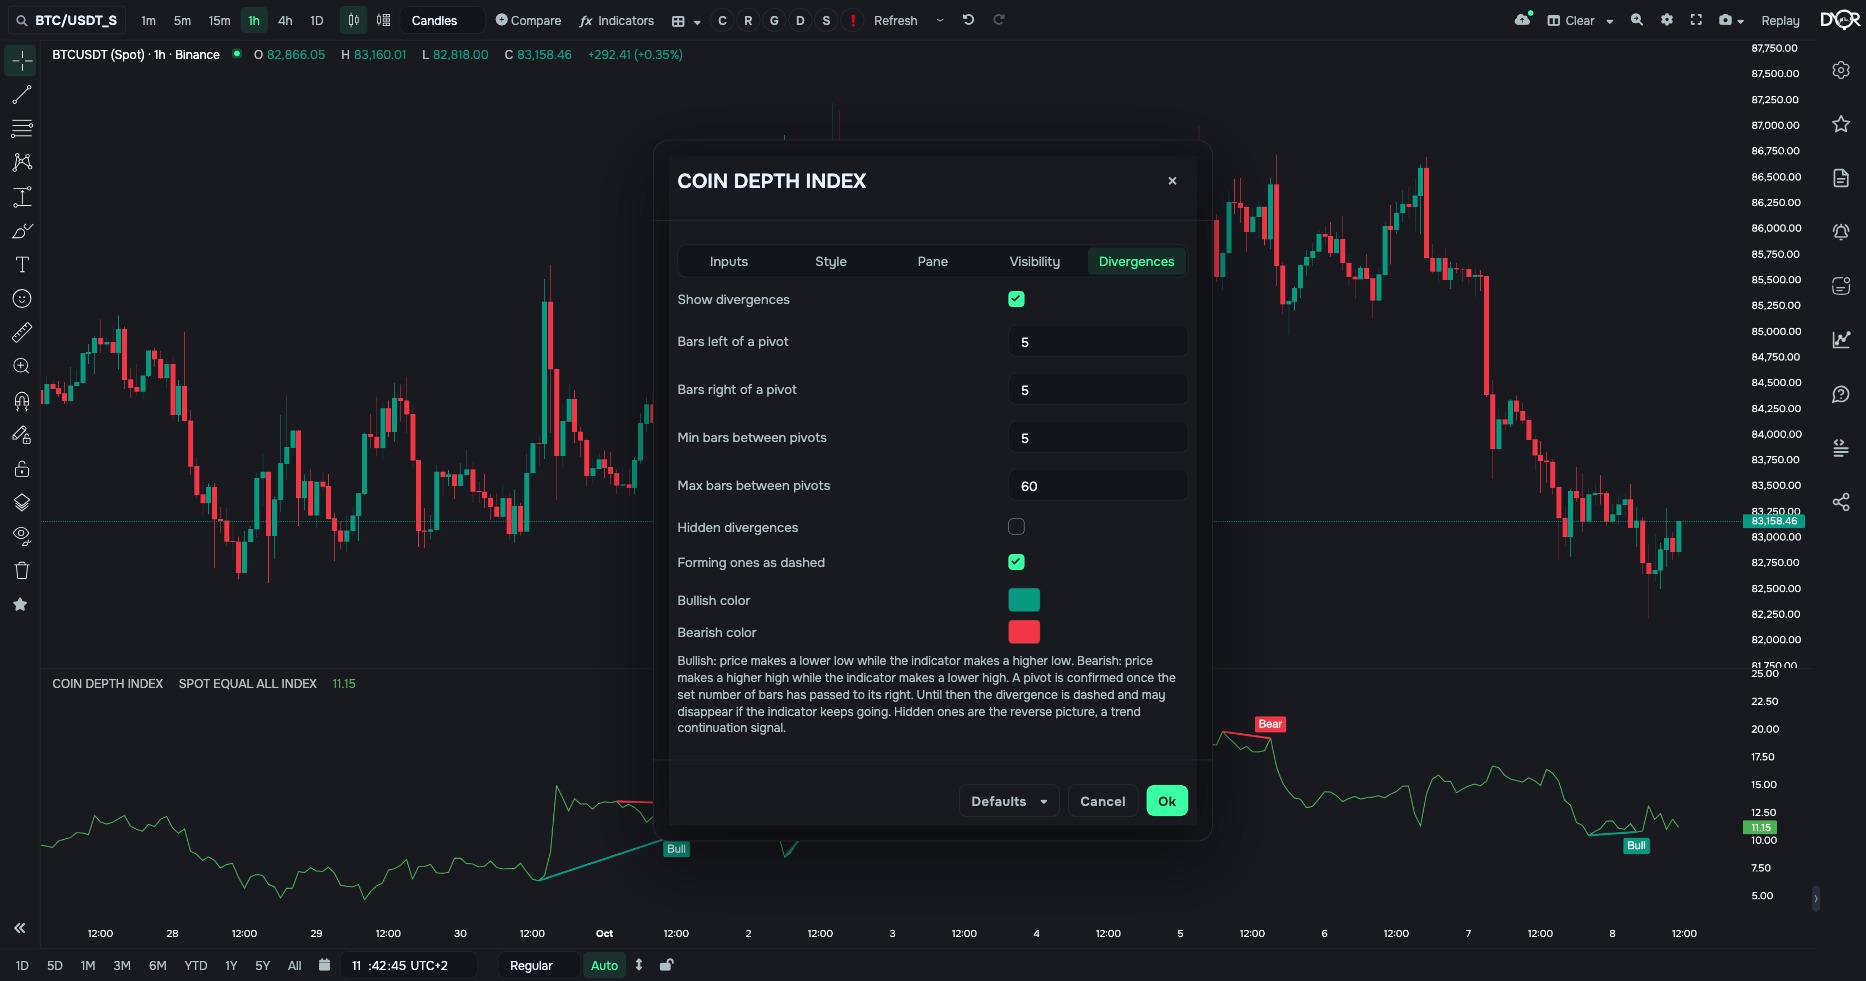
| Field | Options | Default | What it changes |
|---|---|---|---|
| Show divergences | on off | off | Turns the search and drawing on. - Want to see splits on this indicator — on. |
| Bars left of a pivot | 1–50 | 5 | How many candles on the left must be above the low or below the high for the point to count as an extreme. - Want only big turns — set more. - Want to catch small ones — fewer. |
| Bars right of a pivot | 1–50 | 5 | How many candles to wait after the extreme to count it as confirmed. Until they have passed, the divergence is drawn dashed. - Want to see it earlier — fewer, but some dashed ones will disappear. - Want only reliable ones — more. |
| Min bars between pivots | number | 5 | The minimum distance between the two extremes of one divergence. Closer does not count. |
| Max bars between pivots | number | 60 | The maximum distance. Pairs further apart are not searched. |
| Hidden divergences | on off | off | Show the opposite picture — a trend-continuation signal. - Want to see those too — on. |
| Forming ones dashed | on off | on | Draw unconfirmed divergences dashed. - Want only confirmed ones — off. |
| Bullish color · Bearish color | 2 fields | green · red | Colours of the lines and labels. |
The list of comparison operators has Bullish divergence and Bearish divergence. These are events: they have no right-hand side.
A divergence is a split between the price and an indicator line: a new price low without a new indicator low, or the other way round. The platform finds them itself and draws them on the indicator’s pane; dashed — until the second extreme is confirmed. In an alert these are two event operators for a Composite metric.
A divergence on the chart is drawn dashed. What does it mean?
Correct answer: The second extreme is not yet confirmed: fewer candles than set have passed to its right