 Learn hubBlog
Break down the chart limits layer: active orders and history, start and end volume labels, size thresholds.
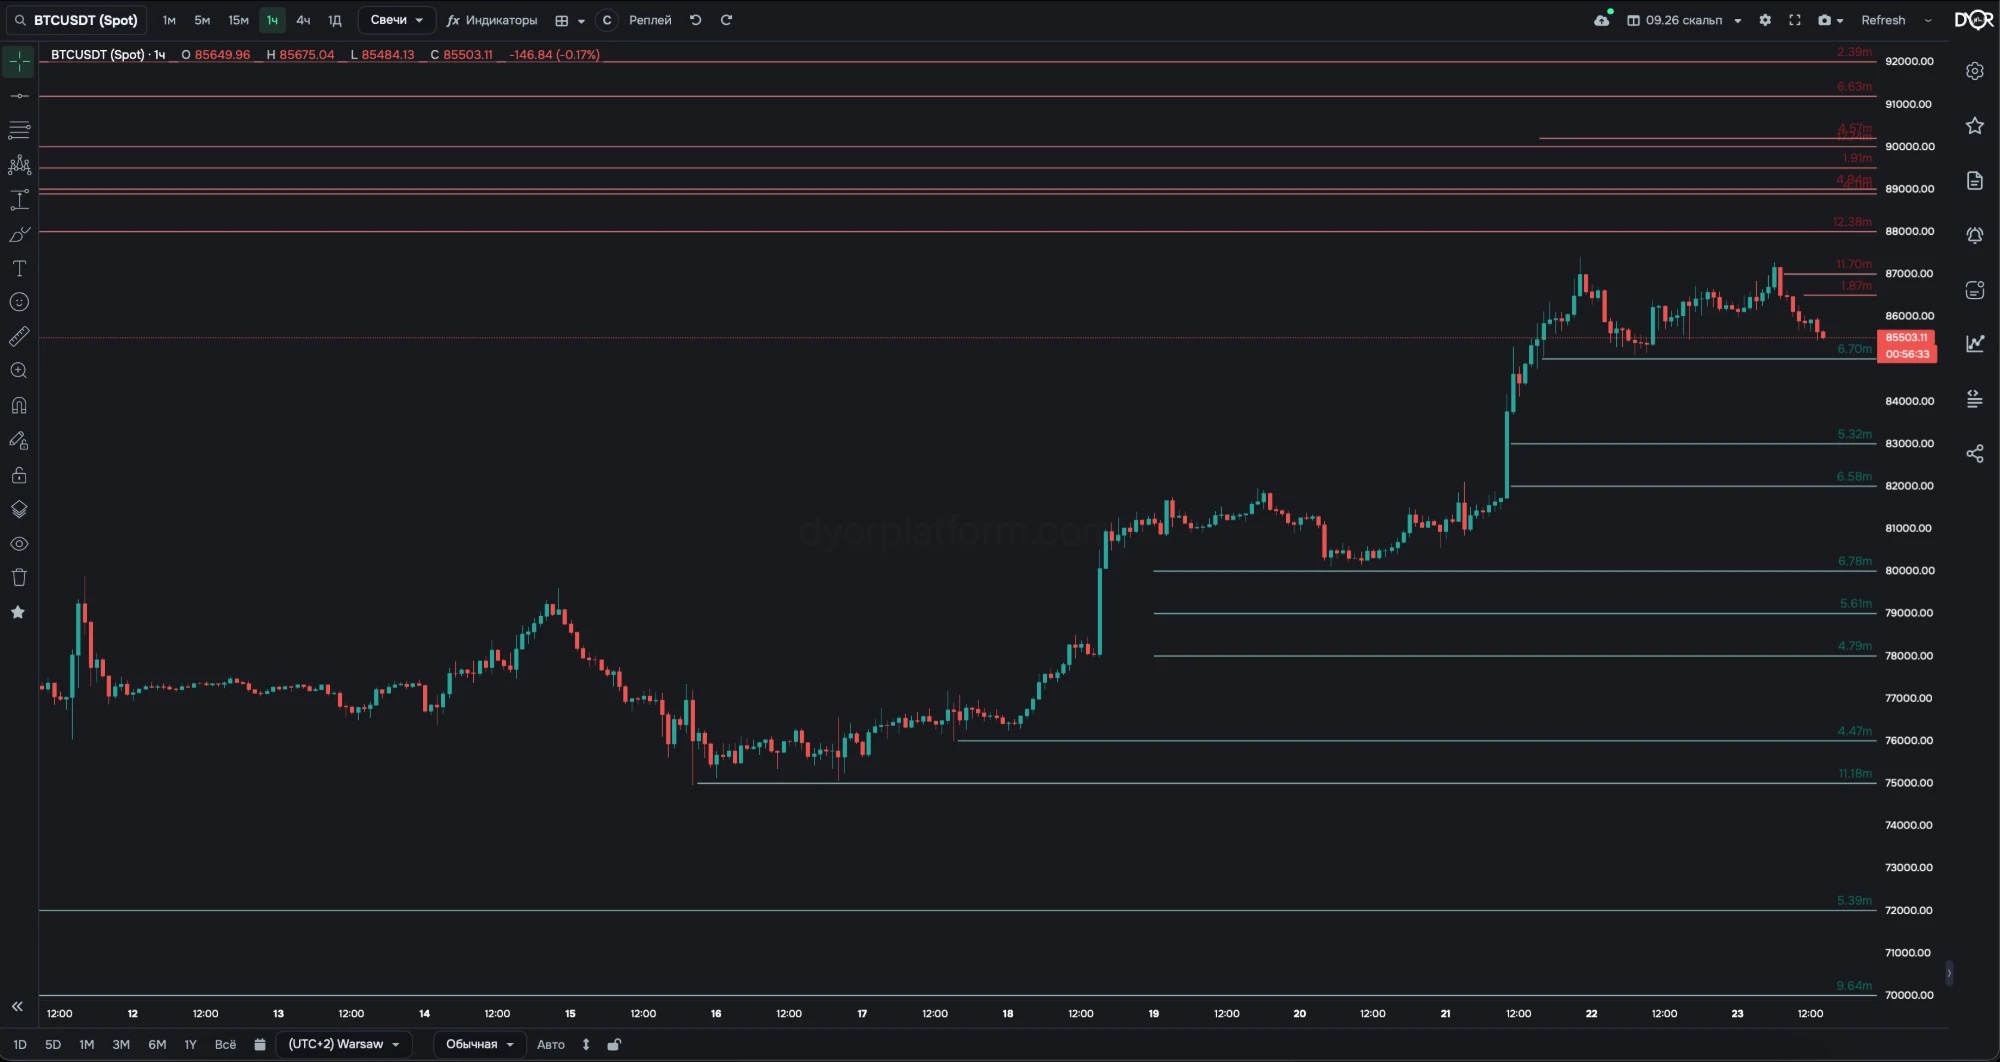
Individual large limit orders as horizontal lines at the order price. Two modes: active orders and history.
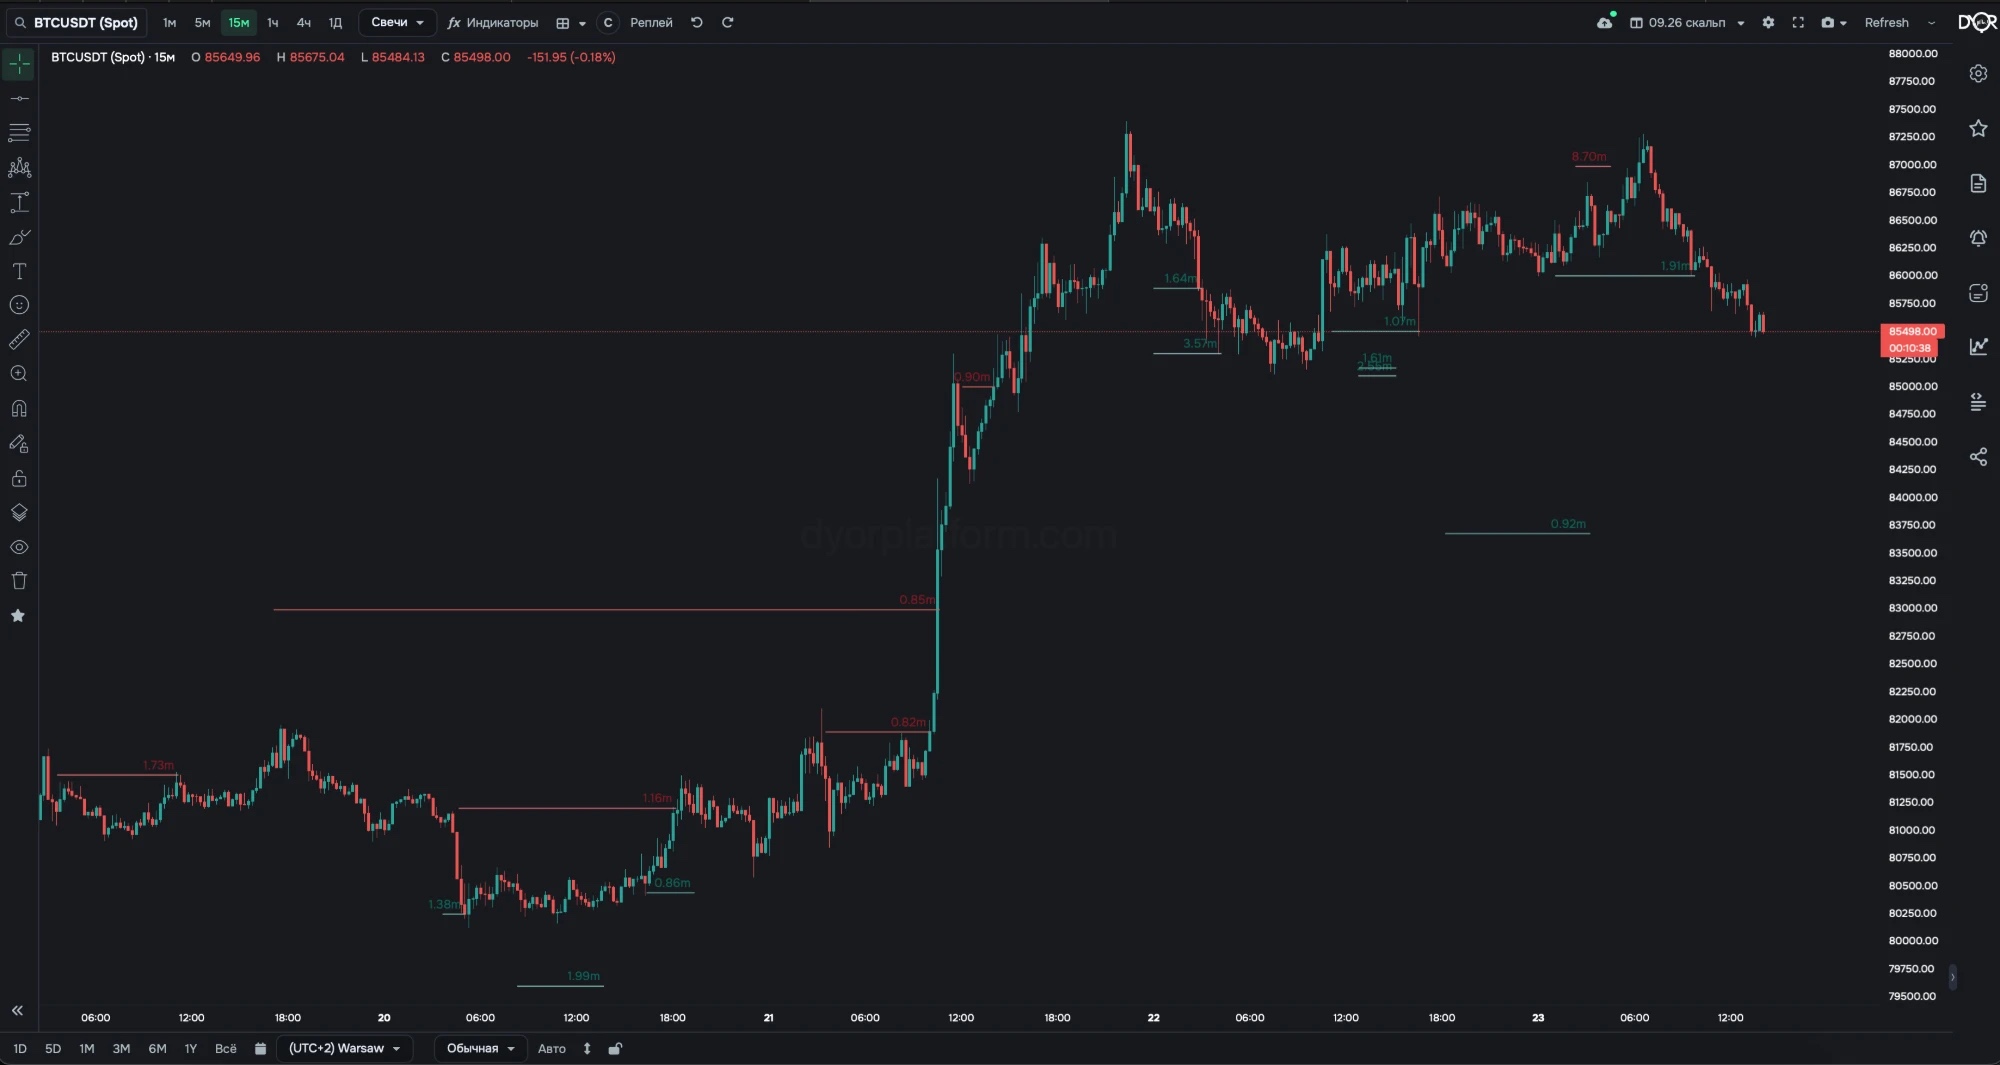
“Show history” adds orders that are already gone. The line runs from appearance to disappearance.
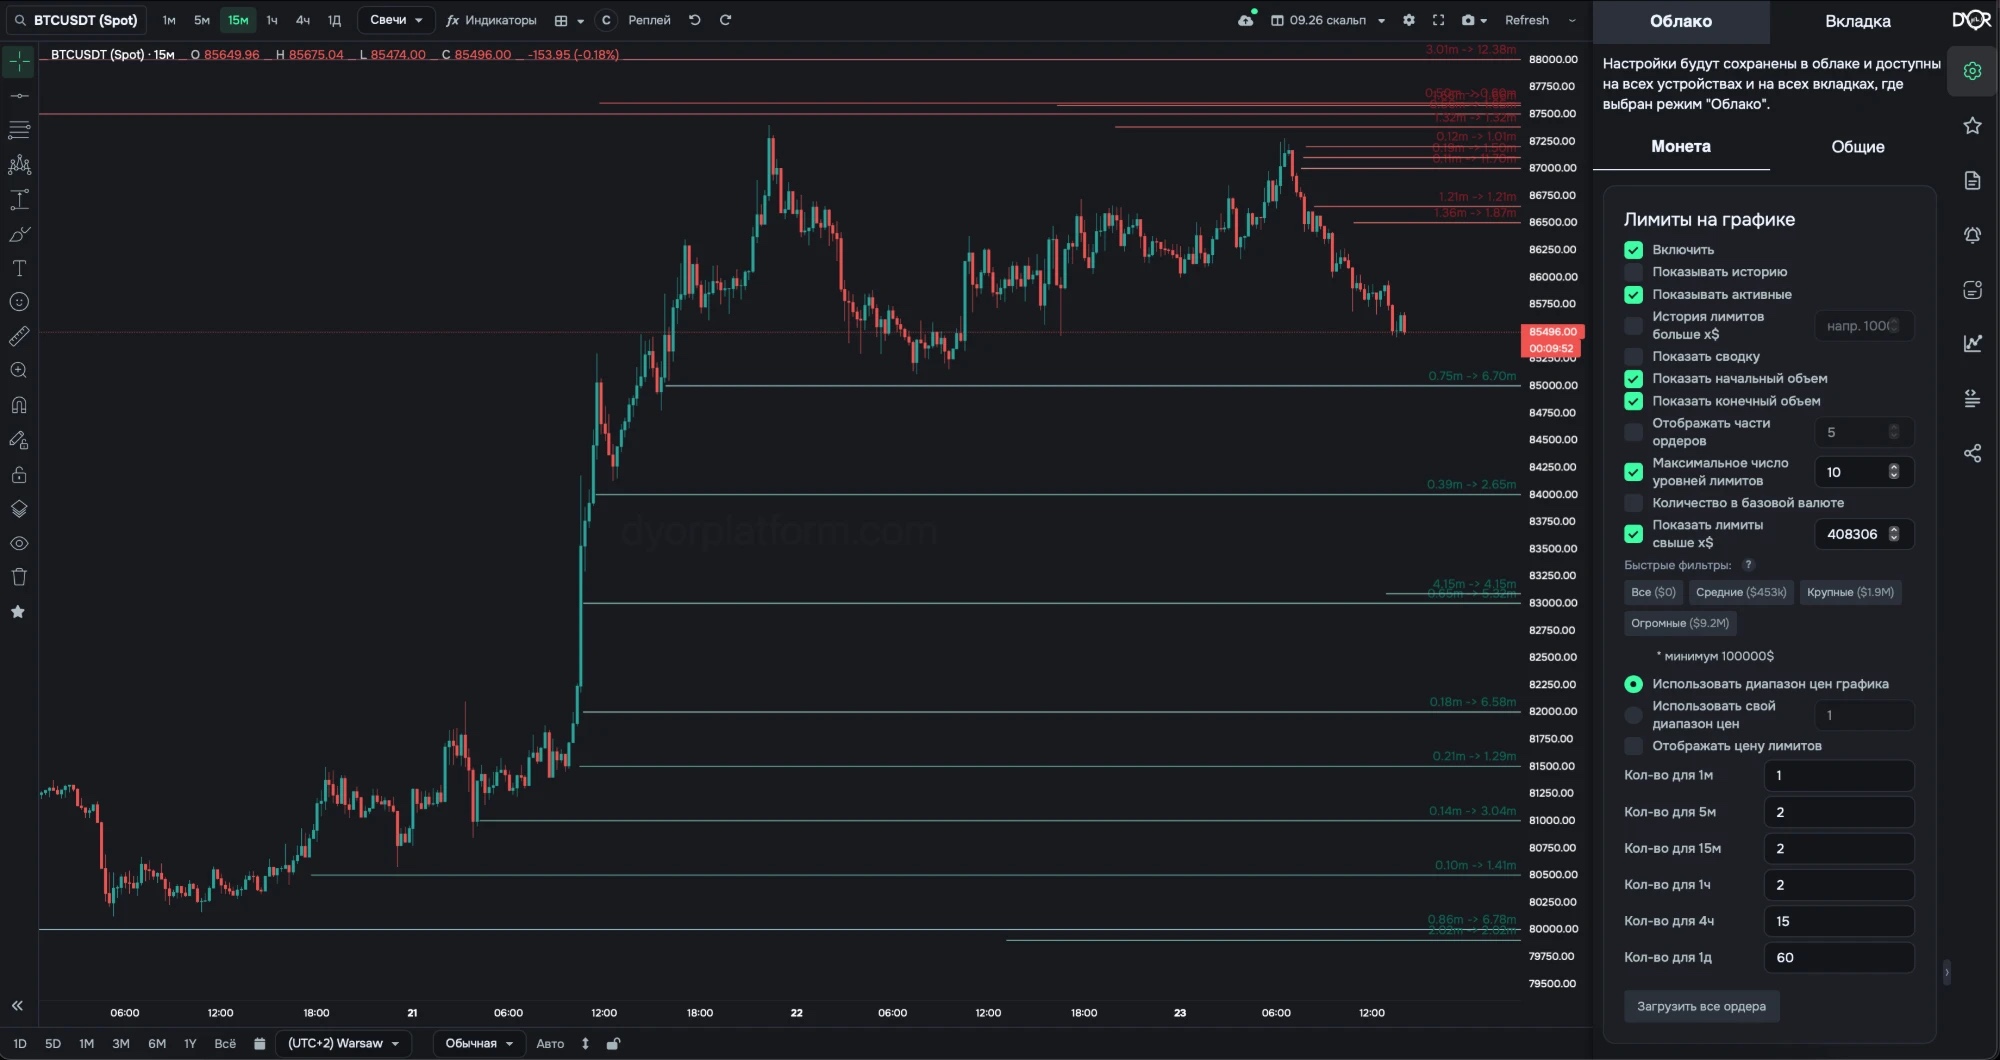
“Show start volume” and “Show end volume” give a two-number label: 0.75m → 6.70m.
How it differs from the heatmap. The heatmap is a snapshot of the whole order book: each price is colored by the total money, big and small orders together, unnamed. Limits list the largest orders one by one: each as a separate line, with its own number and history.
See individual large orders as levels. Where a big buyer or seller stands, how long they have been standing and whether they hold the order.
For example.
Right rail → Settings (first button) → the Coin tab → “Limits on chart” card → Enable. Settings are saved separately for each coin.
| Field | Options | Default | What it changes |
|---|---|---|---|
| Enable | on off | off | Show the limits layer on this coin. |
| Show history | on off | off | Orders that are already gone: filled and pulled. - Want to see where large orders stood and where they went — turn it on. |
| Show active | on off | on | Orders standing in the order book right now. |
| Show history over x$ | amount | — | Size threshold for history. Smaller ones don't get into history. |
| Show summary | on off | off | Summary of active orders: how many there are and for what total. |
| Show start volume | on off | on | The first number in the label: order volume at the moment it appeared. |
| Show end volume | on off | on | The second number in the label: volume now or at the moment it disappeared. |
| Render order parts | on + number | off, 5 | Intermediate numbers instead of two: 1.2m → 900k → 400k. The number is how many parts to show, from 5 to 30. When on, the start and end volume labels are turned off. |
| Max limits count on chart | on + number | on, 10 | How many lines to keep on screen. Too many lines — lower it. |
| Quantity in coin base asset | on off | off | Label in coins instead of dollars. |
| Show limits over x$ | amount | — | Order size threshold, minimum $100,000. Quick filters set the threshold from the size distribution on this coin: Medium — 70th percentile, Large — 95th, Huge — 99.5th. - Want to see only walls — pick “Large” or “Huge”. |
| Price range | chart custom % | chart | Where to look for orders. Chart — within the visible price window. Custom — a percentage around the current price, e.g. 8. |
| Show active limits price | on off | off | Price of active orders on the price scale on the right. |
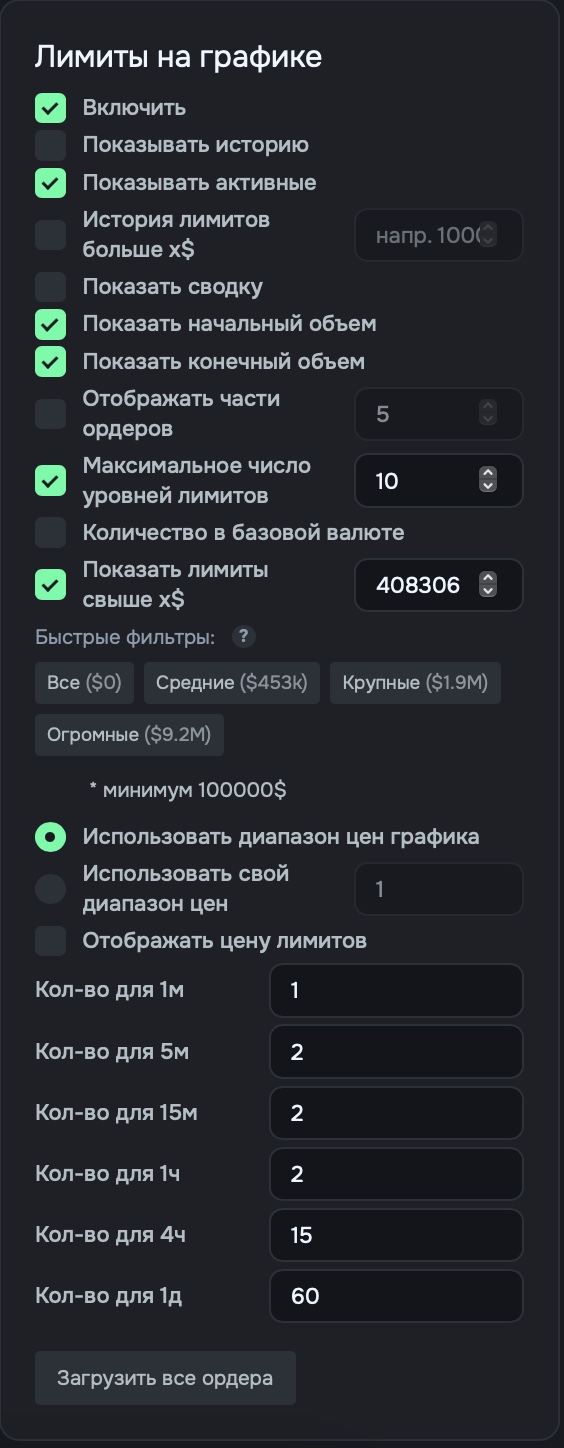
| Min time for 1m … 1d | minutes | — | How many minutes an order must stand in the order book to get on the chart. A separate number for each timeframe. Stood that long — it is shown. Less — it isn't. This is an anti-spoofing filter: walls that are placed and pulled within a minute get filtered out. The screenshot has 1, 2, 2, 2, 15 and 60 minutes. |
| Load All Orders | button | — | Load orders for the whole available history, not just the visible period. |
Yes — limit alert: its own button in the right rail, watches for a specific large order to appear. Covered in the “Alerts” block.
Each line is one large limit order at its price. Green — bid, red — ask, lighter — larger. An active one runs to the current moment, a historical one from appearance to fill or removal. Label 0.75m → 6.70m — how much was placed and how much it became. An alert on such an order is a limit alert.
A Top Limits line broke off, and the price was far from it. What happened?
Correct answer: The order was pulled