Goal
Find everything on the screen that belongs to DYOR: the indicators button, the right rail, pane settings and style.
Five zones. The rest of the course is about what's inside them.
1The Workspace screen
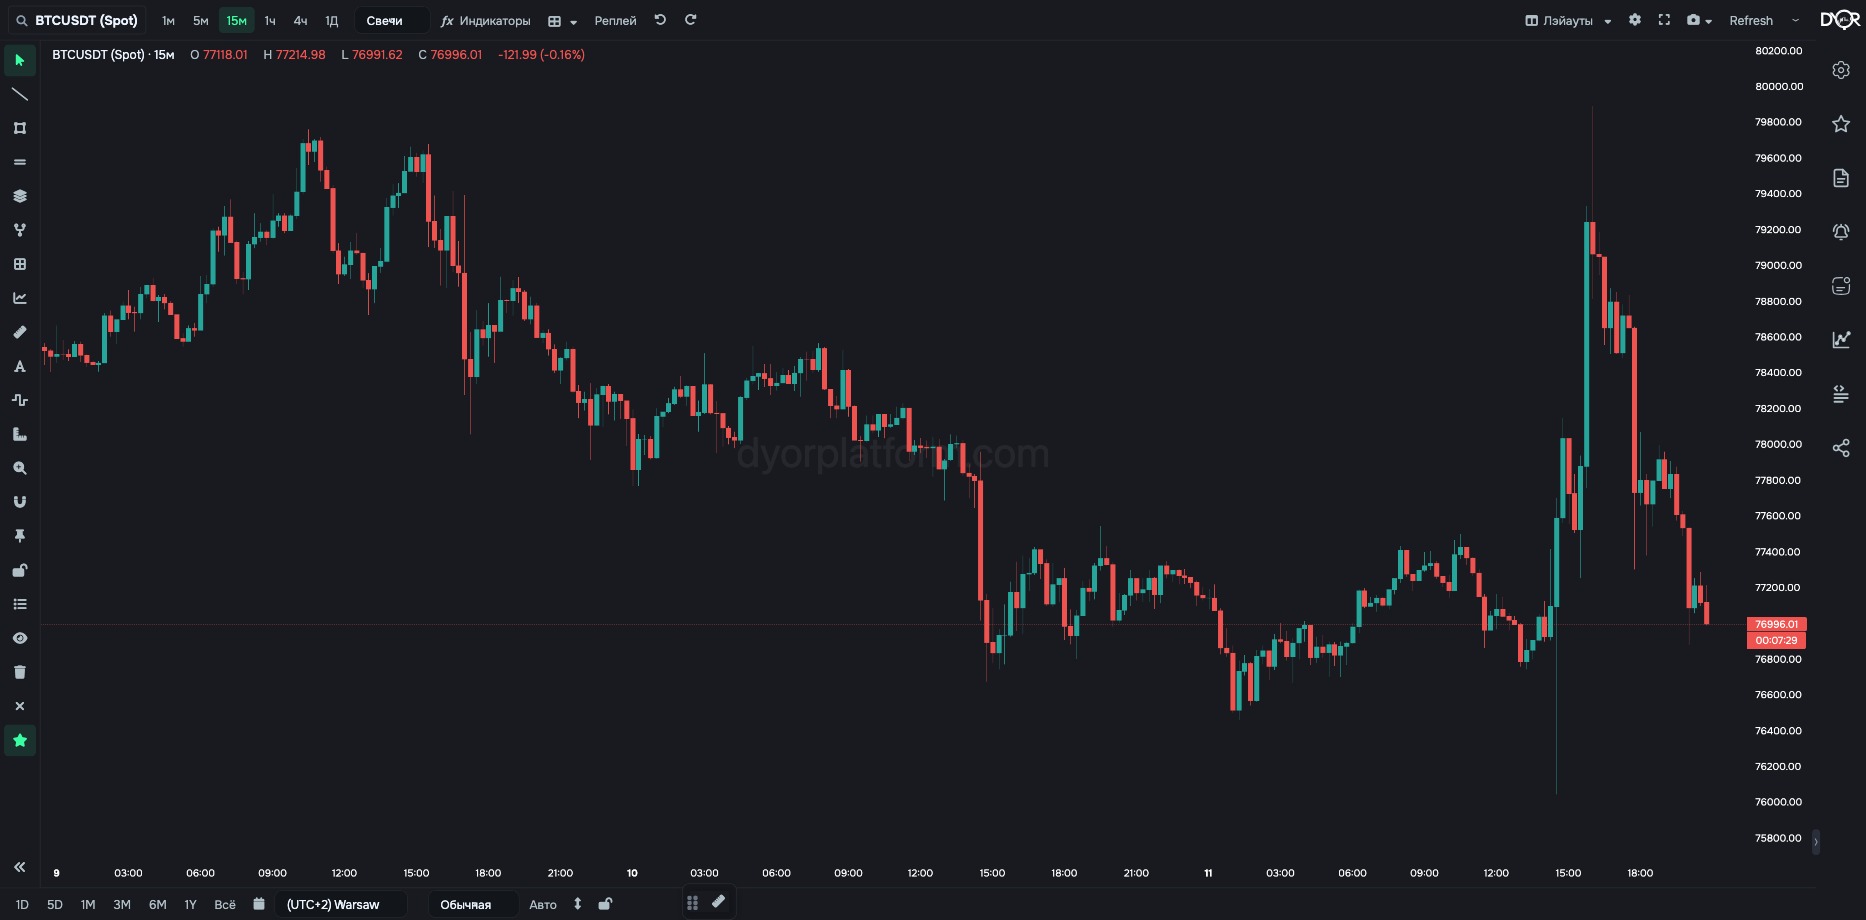 12
12- 1The “ƒx Indicators” button — opens the window with DYOR indicators.
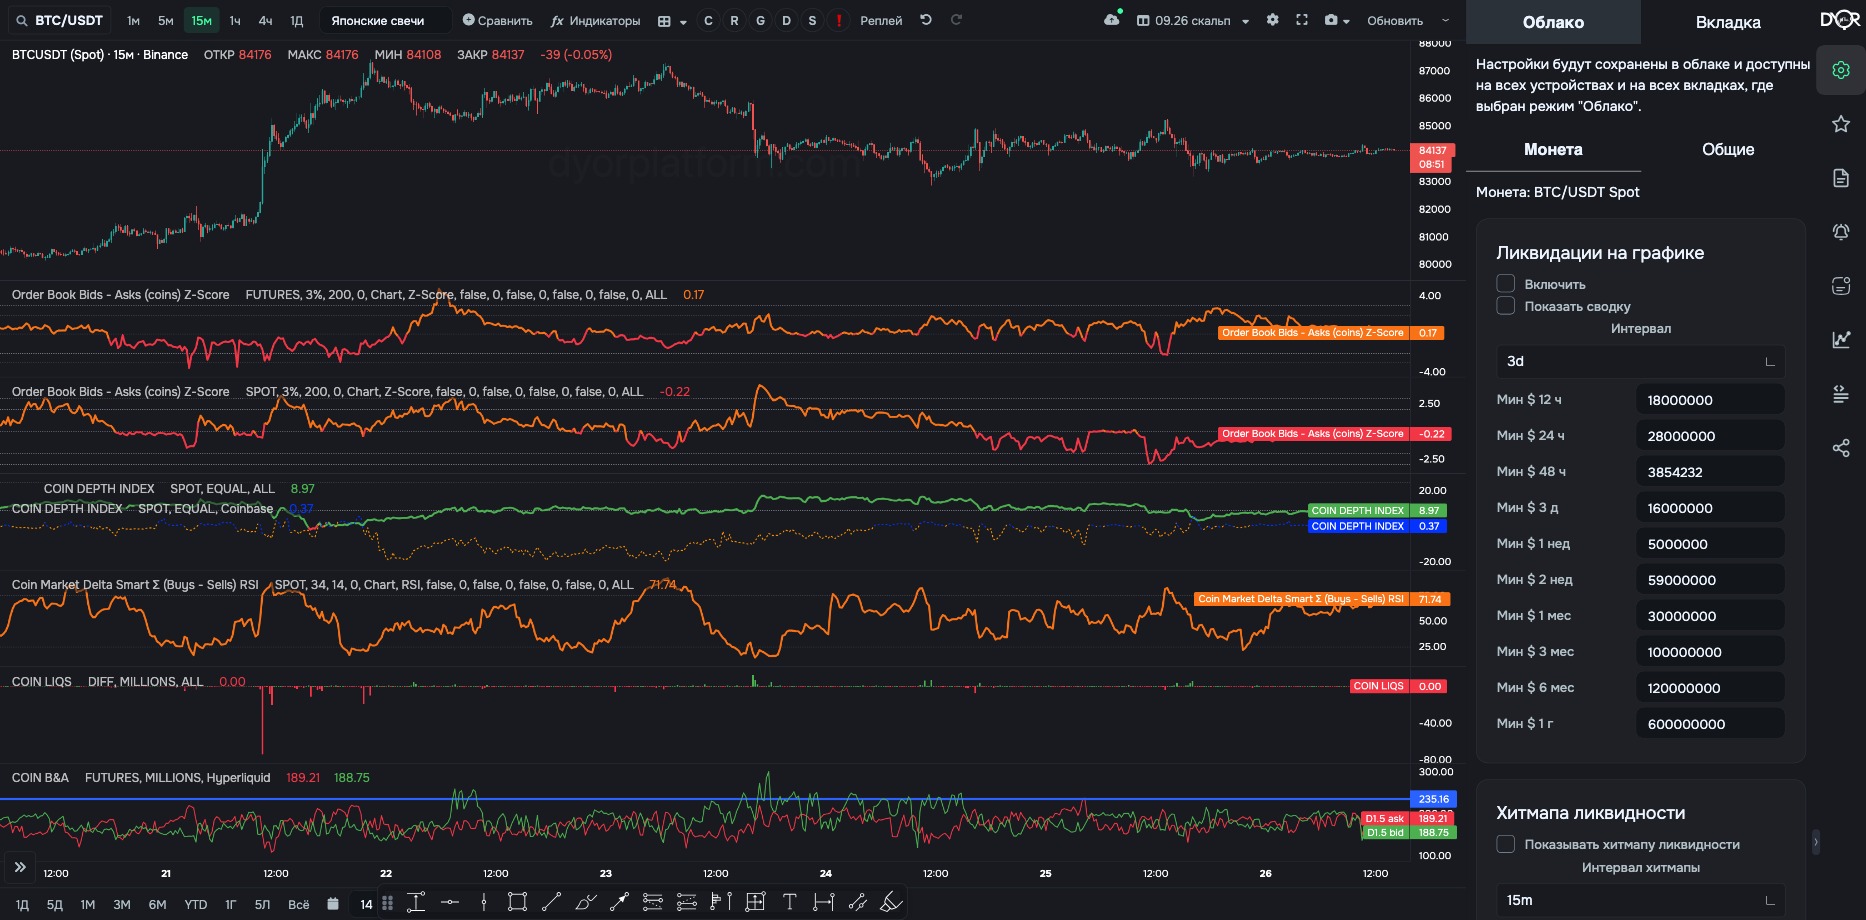
- 2DYOR right rail — chart layers, favorites, notes, alerts, Metrics Builder.
Everything else is a standard chart:
- coin, timeframe and candle type — top left;
- drawing toolbar — on the left, with the same tool groups as in TradingView;
- replay, layouts and snapshot — top right;
- the quick save button (cloud) — left of “Layouts”. A dot on it means there are unsaved changes. Ctrl+S does the same.
2Indicators
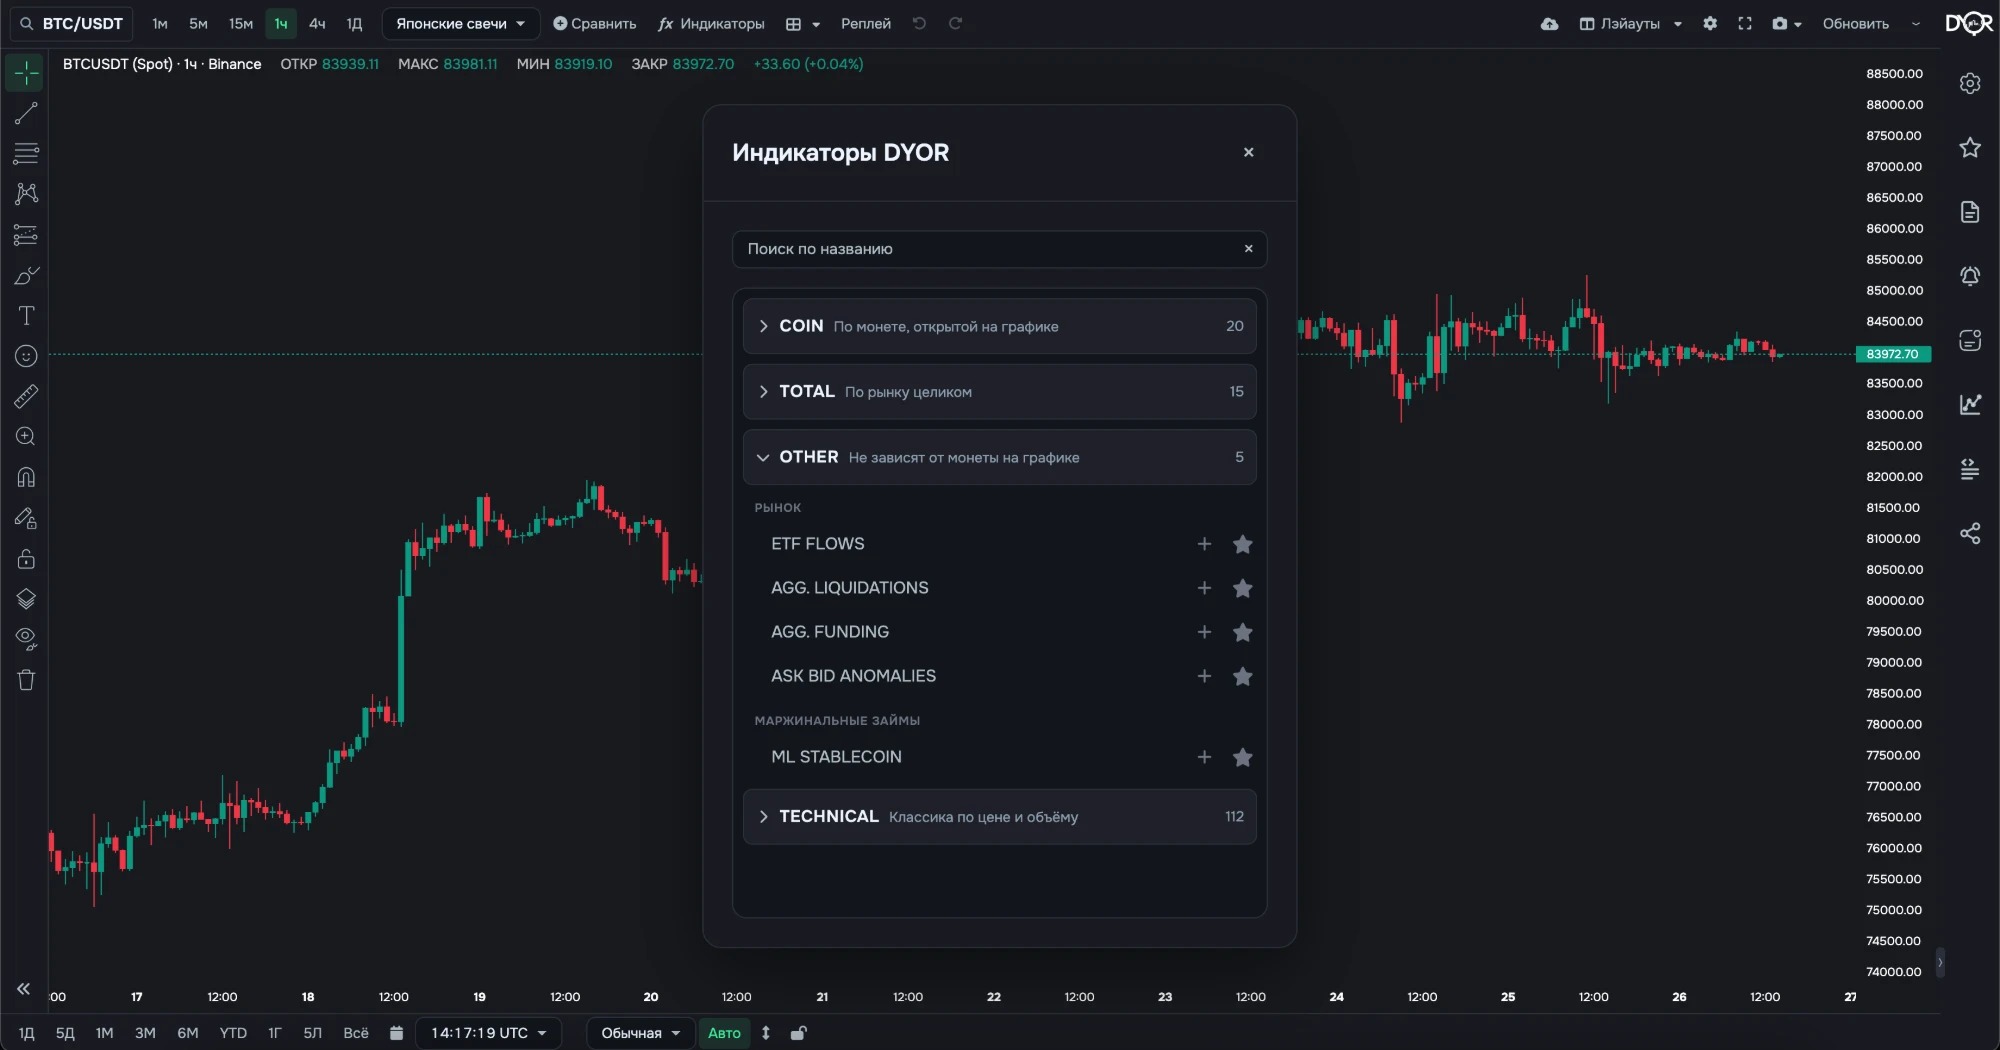
Click “ƒx Indicators” in the top bar to open the “DYOR Indicators” window. Click a name or the plus to add the indicator under the chart; the star adds it to favorites
Inside the window: search by name and four groups — COIN, TOTAL and OTHER (covered on the next screen) and TECHNICAL, classic price and volume tools not covered in the course. OTHER has two subgroups: “Market” and “Margin lending”. The PRO label marks a paid indicator.
The window stays open after you pick one. You can add several indicators in a row; each addition is confirmed with a notification. Close the window with the cross or Esc.
3Right rail
Settings — layers over the chart: liquidations, liquidity heatmap, limits
Favorites — coins and market indices
Notes — text attached to the chart
Alerts — alert list, “Add” and “Create alert” buttons
Limit alerts — alerts on large limit orders
Metrics Builder — a technical indicator on top of any DYOR data
System — version, tools, screenshot
Share — link to the chart
The first rail button, “Settings”: chart layers for the current coin
4Indicator settings
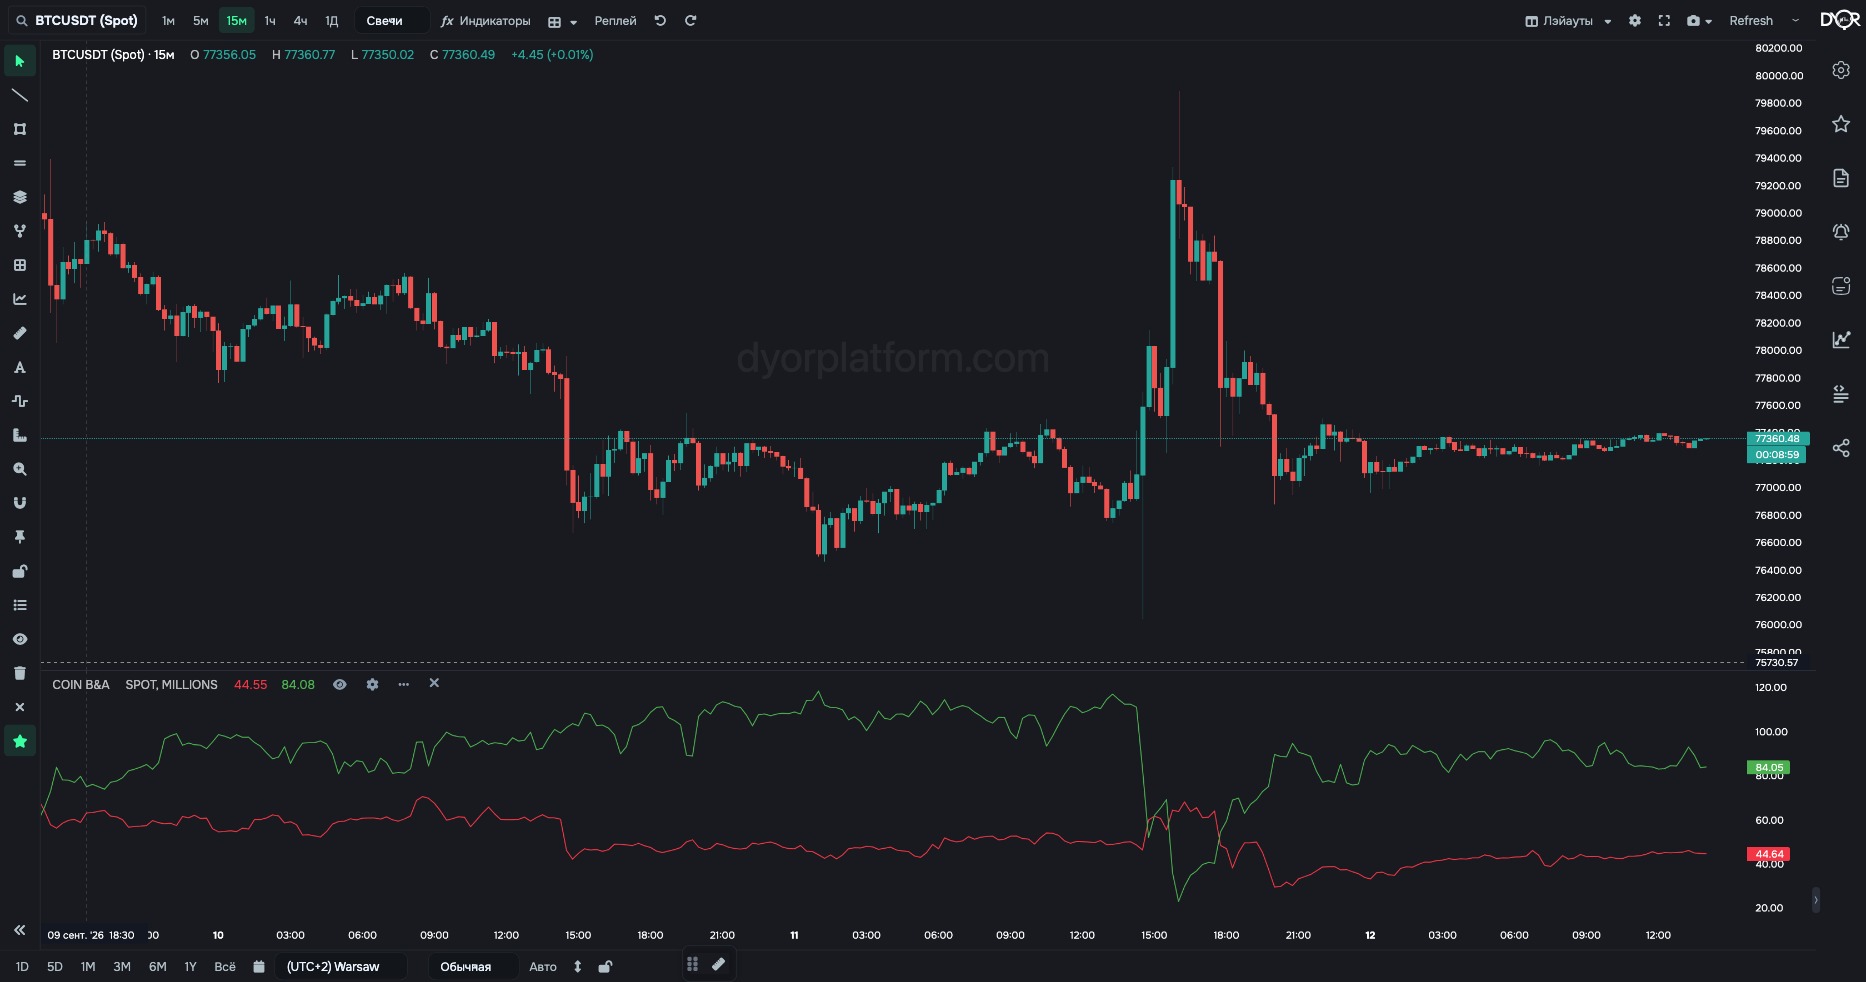
Hover over the pane title: four buttons appear — hide, settings (gear), menu, remove. Click the gear
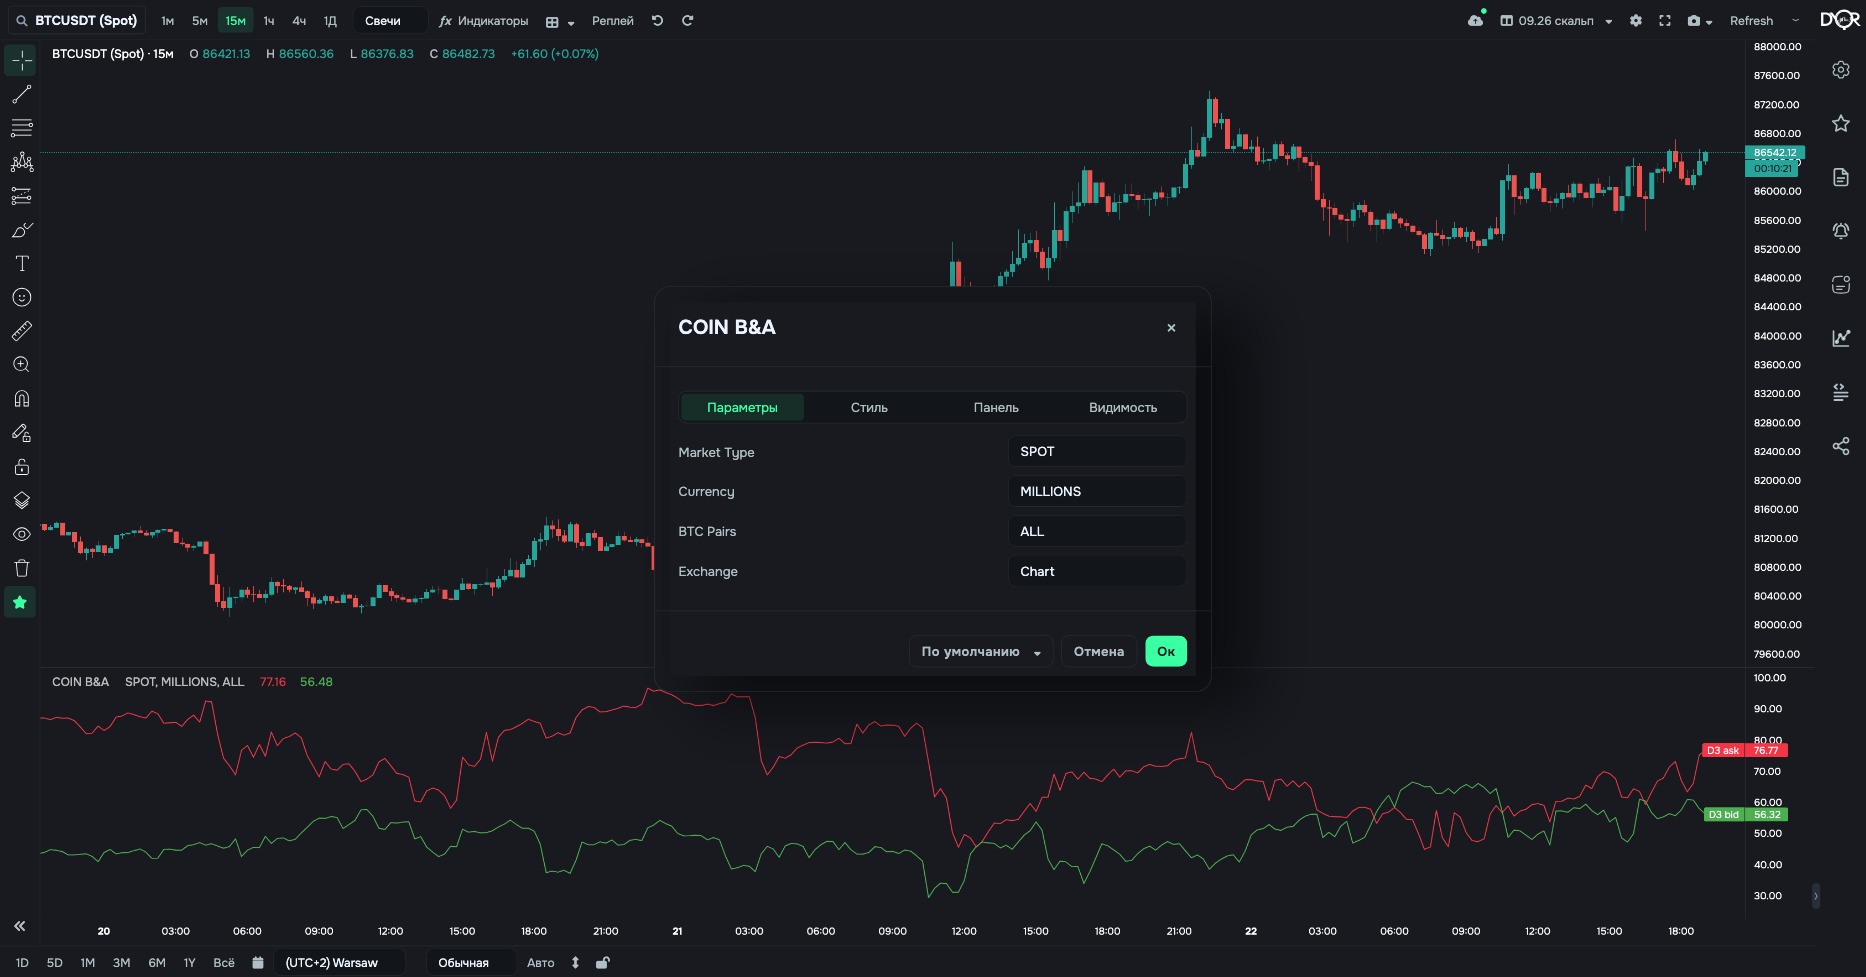
Settings are open. The “Inputs” tab sets what to calculate
Each indicator has its own set of inputs. They are covered on its screen in the “Settings” table.
Two more tabs in this window:
- Pane — where to place the indicator: over the price, in a new pane or in another indicator's pane. The scale is chosen here too.
- Visibility — which timeframes to show it on.
The “More” button (⋯) in the legend and a right click on the pane open the same menu:
- Duplicate — a copy of the indicator on the same pane, with the same inputs and style;
- Copy — the indicator to the clipboard; to paste it on another chart, right-click the chart → “Paste indicator” or Ctrl+V;
- placement and scale;
- what to show in the legend;
- remove.
5Styling
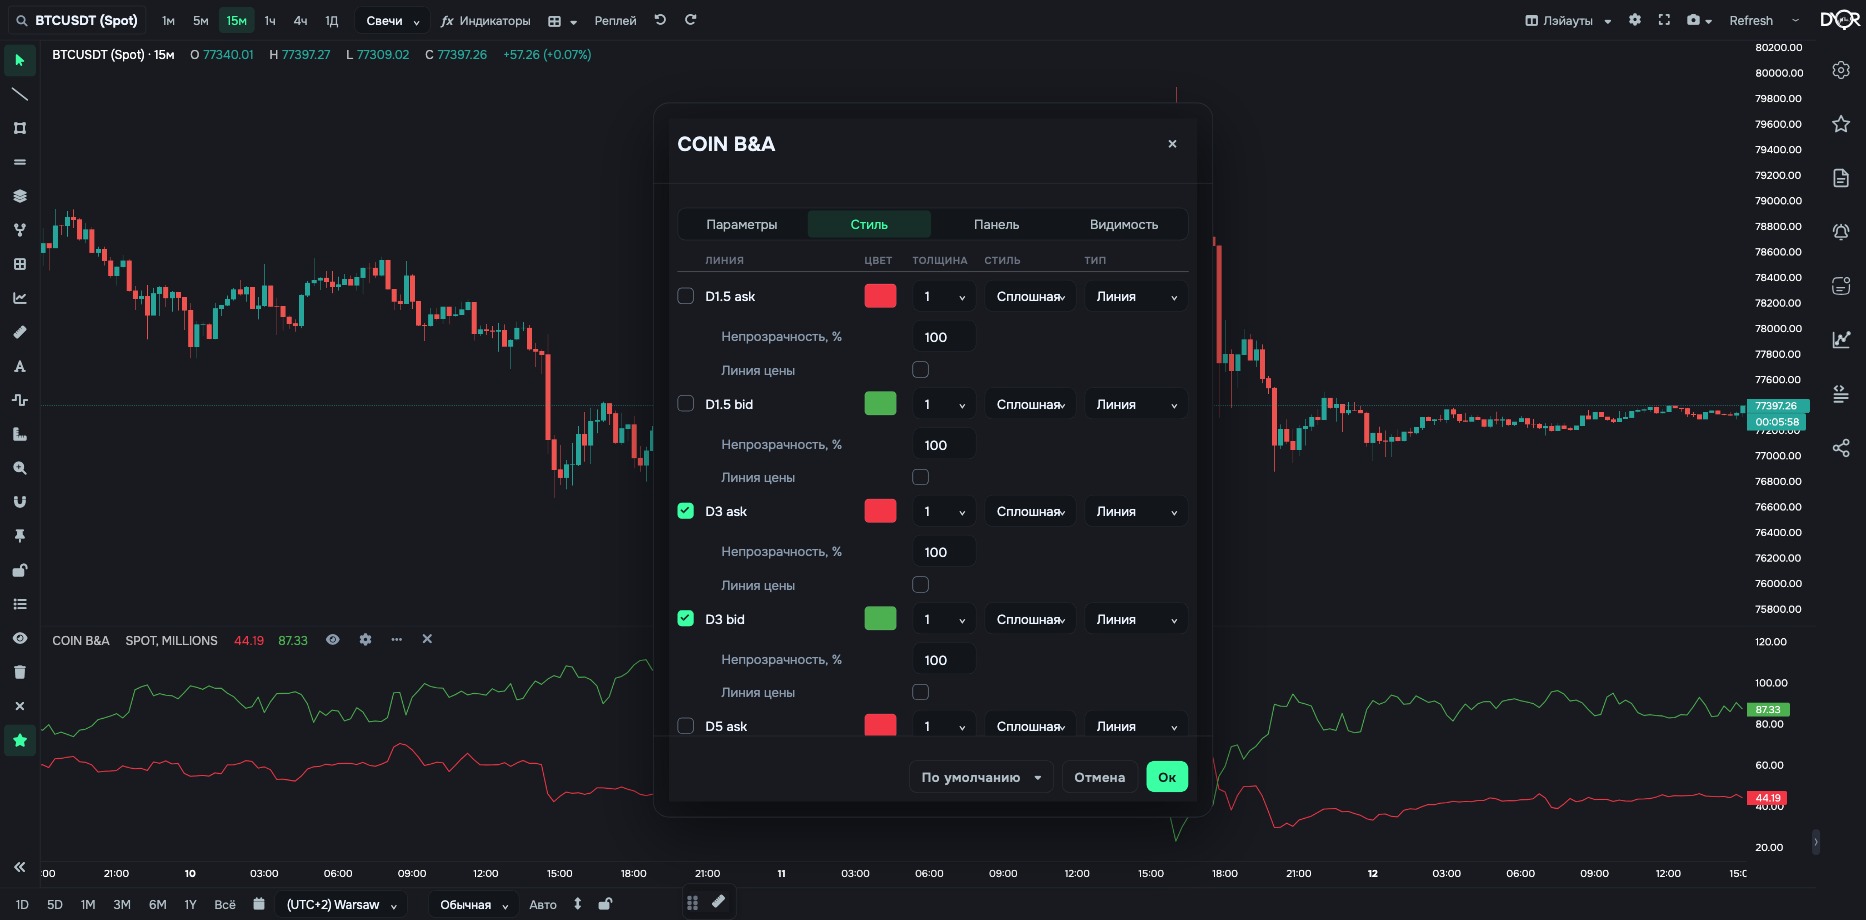
The “Style” tab: which lines are visible, their color, width and type. Here COIN B&A has seven depths, only D3 is on
Takeaway
Two entry points. The “ƒx Indicators” button adds panes under the chart; the window stays open while you add. The right rail holds layers, alerts and the builder. Settings of any pane: the gear that appears when you hover over its title. “Inputs” is what to calculate, “Style” is how to draw. The ⋯ menu duplicates and moves.
 Learn hubBlog